Link

Weekly Charts
Started by
Chilidawgz
, Oct 14 2012 12:03 AM
13 replies to this topic
#1

Chilidawgz
-
- Traders-Talk User
- 5,649 posts
A fool and his money... (the second mousie gets the cheese)
Posted 14 October 2012 - 12:03 AM
Anything can happen...what's happening now?
No one can forecast the future. No one.
All stocks (ETF's) are BAD...unless they go up - William O'Neil
When The Time Comes To Buy or Sell, You Won't Want To - Walter Deemer
#2
Bernie
-

- Traders-Talk User
- 431 posts
Member
#3
chem
-

- Traders-Talk User
- 190 posts
Member
Posted 25 January 2013 - 12:45 AM
Hey Chili got this message from your link

The website that you have requested has been taken off line because the user has exceeded their bandwidth quota. If this is your website you can change this behaviour in the Sonic.net MemberTools.
#4
Chilidawgz
-
- Traders-Talk User
- 5,649 posts
A fool and his money... (the second mousie gets the cheese)
Posted 28 July 2017 - 07:03 PM
Been a long time since I posted on this forum. I am an intermediate trader not a day trader. The forum has evolved to 99.9% day trading so I rarely post. I go back on this forum to when it was more balanced with posters and content. Things change. Anyways the long trend is still up as it has been for 9 years. No sign of a top yet, no sign of a recession.


Anything can happen...what's happening now?
No one can forecast the future. No one.
All stocks (ETF's) are BAD...unless they go up - William O'Neil
When The Time Comes To Buy or Sell, You Won't Want To - Walter Deemer
#5
Chilidawgz
-
- Traders-Talk User
- 5,649 posts
A fool and his money... (the second mousie gets the cheese)
Posted 23 August 2017 - 11:26 AM
Still a bull but that triangle is narrowing. Price must break higher or we could get an intermediate sell signal.


Edited by Chilidawgz, 23 August 2017 - 11:30 AM.
Anything can happen...what's happening now?
No one can forecast the future. No one.
All stocks (ETF's) are BAD...unless they go up - William O'Neil
When The Time Comes To Buy or Sell, You Won't Want To - Walter Deemer
#6
Chilidawgz
-
- Traders-Talk User
- 5,649 posts
A fool and his money... (the second mousie gets the cheese)
Posted 17 February 2018 - 12:27 PM


Anything can happen...what's happening now?
No one can forecast the future. No one.
All stocks (ETF's) are BAD...unless they go up - William O'Neil
When The Time Comes To Buy or Sell, You Won't Want To - Walter Deemer

#8
Chilidawgz
-
- Traders-Talk User
- 5,649 posts
A fool and his money... (the second mousie gets the cheese)
Posted 24 February 2018 - 12:59 AM
price looks like it wants to rise.


Anything can happen...what's happening now?
No one can forecast the future. No one.
All stocks (ETF's) are BAD...unless they go up - William O'Neil
When The Time Comes To Buy or Sell, You Won't Want To - Walter Deemer
#9
Chilidawgz
-
- Traders-Talk User
- 5,649 posts
A fool and his money... (the second mousie gets the cheese)
Posted 24 February 2018 - 01:24 AM
BTW, I am all cash as of the previous Friday. I am not a day trader or sclaper. I manage retirement funds. My objective is not to beat the market. I want a reasonable return but want to avoid declining markets. I usually run 65% in stock ETF's. I also moved out of bonds and into cash.
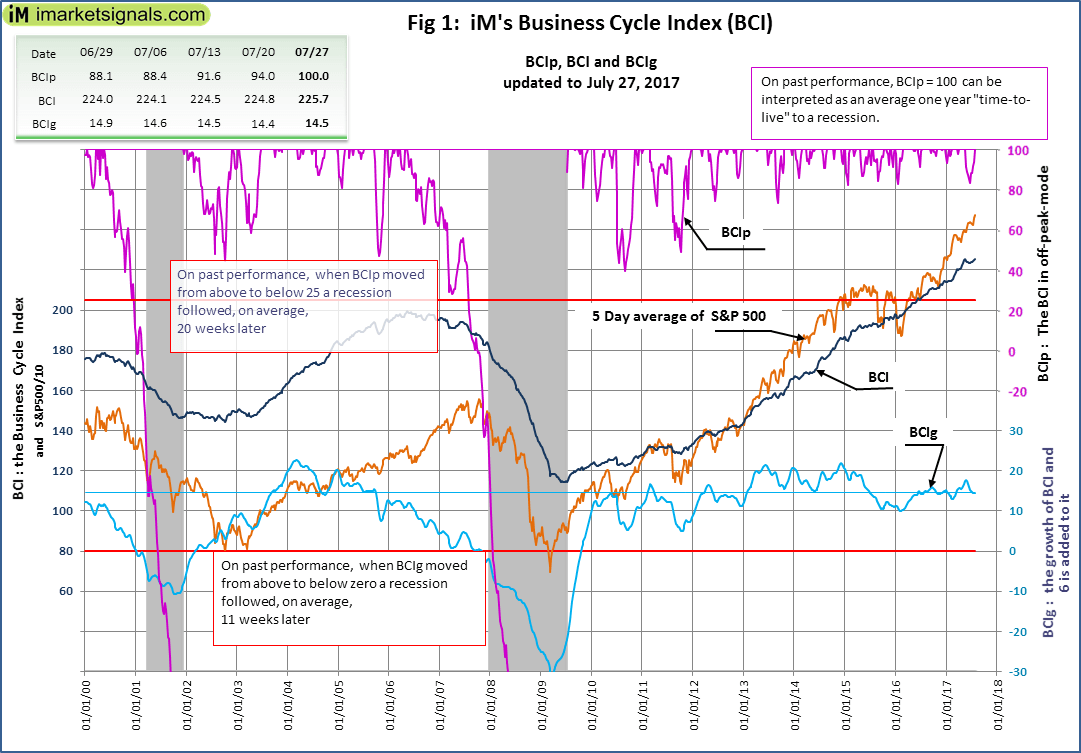
Keep your eyes on this, it's signaling caution:

Edited by Chilidawgz, 24 February 2018 - 01:25 AM.
Anything can happen...what's happening now?
No one can forecast the future. No one.
All stocks (ETF's) are BAD...unless they go up - William O'Neil
When The Time Comes To Buy or Sell, You Won't Want To - Walter Deemer
#10
Chilidawgz
-
- Traders-Talk User
- 5,649 posts
A fool and his money... (the second mousie gets the cheese)
Posted 24 February 2018 - 07:18 PM
For those of you running longer term money and managing portfolio allocation, I would suggest you subscribe to Lance Roberts weekly and daily commentary. It's free and he knows his "stuff".
Anything can happen...what's happening now?
No one can forecast the future. No one.
All stocks (ETF's) are BAD...unless they go up - William O'Neil
When The Time Comes To Buy or Sell, You Won't Want To - Walter Deemer


