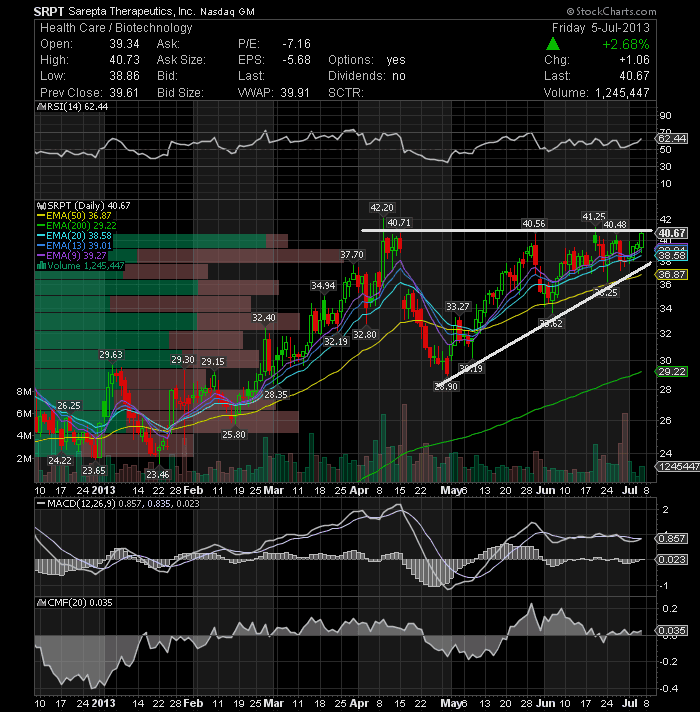
The stock is currently showing a bullish ascending triangle pattern putting pressure on the 41 level. If it breaks out of the ascending triangle, target price is around 50. Triangles tend to be continuation patterns and in this particular case, the break out is likely to be in the direction in which the stock was headed before entering the triangle. From a technical standpoint, indicators are sending bullish signals. The MACD is above the signal line and the RSI & Slow stochastic are both rising above their 50% levels. Additionally, the stock price is above all major EMAs. Watch for a close above 41. It could mean further upside for the stock. On the down side, the 50-day EMA should provide support.
Bullish set-ups to watch next week