
Universal Display Corporation (NASDAQ:OLED)
Started by
Costa
, Sep 06 2013 12:45 AM
1 reply to this topic
#1
: post #1")
Costa
-
- Traders-Talk User
- 660 posts
Member
Posted 06 September 2013 - 12:45 AM
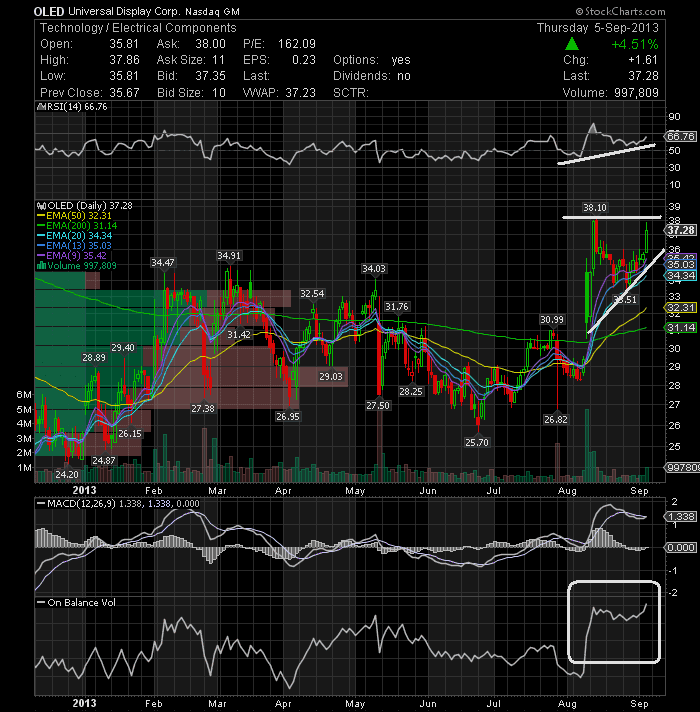
The chart of Universal Display Corporation (NASDAQ:OLED) caught my eye today. On the above technical chart, we can quickly see that the stock is forming an ascending formation waiting to be broken. A move above the triangle (38.1 levels) can trigger a sharp upside move towards 40. The money seems to be flowing into the stock as indicated by the technical indicator OBV. OLED is also a short squeeze candidate, with a short float at 25% (equivalent to 7 days of average volume). Since the trend prior was bullish, the breakout is likely to be to the upside.
Costa
AC Investor Blog Keep up to date by subscribing AC Investor Blog newsletter or RSS feed. You may wish to also follow me on Twitter.
AC Investor Blog Keep up to date by subscribing AC Investor Blog newsletter or RSS feed. You may wish to also follow me on Twitter.
#2
tradesurfer
-

- Traders-Talk User
- 2,944 posts
Member
Posted 06 September 2013 - 09:16 AM
Your latest thoughts on ATOS ?
Looks like a nice soild base, triple bottom, harmonic bullish butterfly pattern and high volume off the bottom. Seems to suggest stage 2 advance in store next months.


