Stocks to Watch for October 02, 2013

Member
Posted 02 October 2013 - 12:26 AM
Member

Posted 02 October 2013 - 04:30 AM
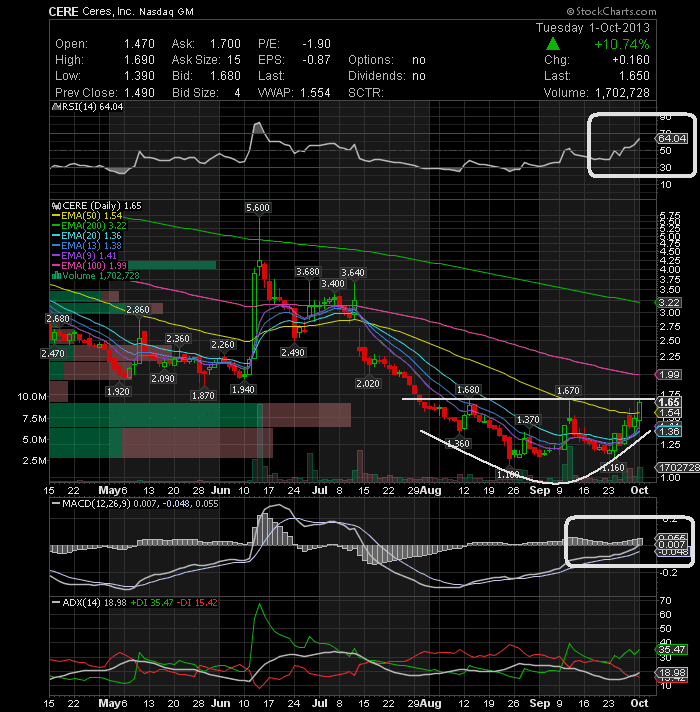
The stock traded heavy volume as it hit a high of $1.69. This high is resistance for Wednesday's continuation move. If the stock can manage a breakout above this horizontal resistance line on high volume, it would be a good buying opportunity, with a stop at 1.44. All indicators in the technical daily chart are in favor of an upward price movement. MACD has generated a buy signal crossing above the zero line. This momentum could push this stock much higher from here, so keep it on the radar. If it breaks above 1.69, the next major resistance is located at $2
Stocks to Watch for October 02, 2013

Member
Posted 02 October 2013 - 09:29 AM
The stock traded heavy volume as it hit a high of $1.69. This high is resistance for Wednesday's continuation move. If the stock can manage a breakout above this horizontal resistance line on high volume, it would be a good buying opportunity, with a stop at 1.44. All indicators in the technical daily chart are in favor of an upward price movement. MACD has generated a buy signal crossing above the zero line. This momentum could push this stock much higher from here, so keep it on the radar. If it breaks above 1.69, the next major resistance is located at $2
Stocks to Watch for October 02, 2013
looks interesting, we could be looking at a small double bottom or a small triangle
with both targeting $2.25,of course a small pullback first is always possible.
Best of Luck.


