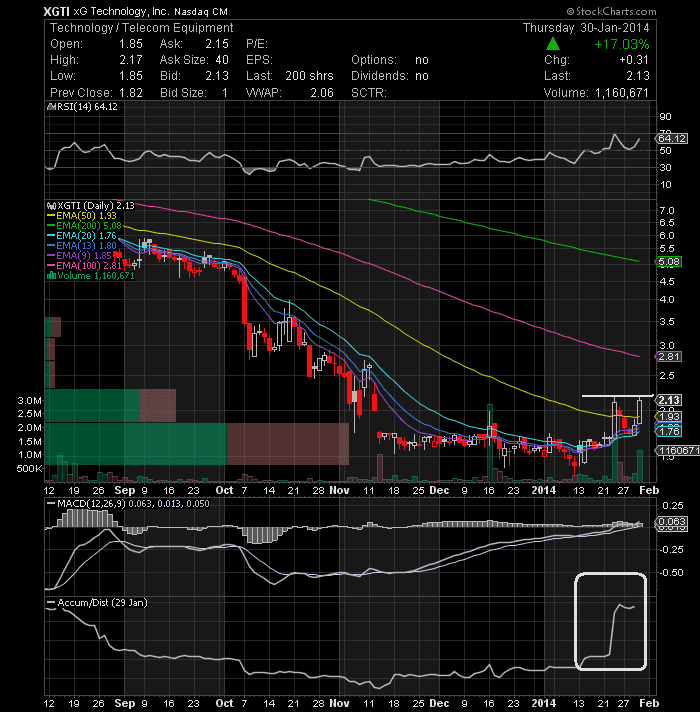
The Technical chart above shows a stock that is right on the cusp of a BIG BREAKOUT. On the daily chart this one looks great. A breakout over 2.20 on heavy volume is a strong buy, targetting first resistance at 2.81. The MACD oscillator is above zero and above its trigger, showing strength for the price to continue its upward path. Additionally, the accumulation/distrubtion indicator shows a sharp break to the upside that means Market Makers are snapping up shares. All technical signs are pointing to a nice rally from here.
Stocks to Watch for January 31, 2014