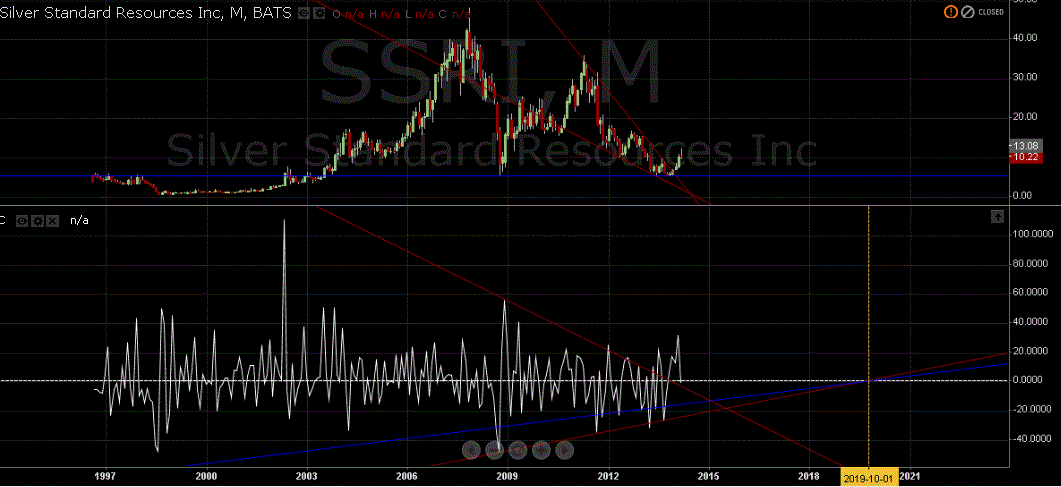
if u look at the lt chart of ssri from 99 lows to top in 07 ssri did 5 waves up. then it did an A wave down a B wave up into may of 2011. look at the decline from 2011. that is a C wave which is complete imo. that stock is not going down to test the lows again. and that has implication for the whole sector imho . all fwiw

ssri and the entire sector
Started by
gannman
, Mar 29 2014 07:54 PM
3 replies to this topic
#1

Posted 29 March 2014 - 07:54 PM
feeling mellow with the yellow metal
#2

Posted 30 March 2014 - 12:05 AM
Good observation Gannman, there is a huge wedge on the chart from 2011 that it just broke out of, it looks very bullish and my oscillator is pointing towards late 2019 or early 2020 as the next major peak for Silver Standard Resources, which is also the pi cycle low time when confidence will be at a low for the economy.
"Nulla tenaci invia est via" - Latin for "For the tenacious, no road is impossible".
"In order to master the markets, you must first master yourself" ... JP Morgan
"Most people lose money because they cannot admit they are wrong"... Martin Armstrong
http://marketvisions.blogspot.com/
"In order to master the markets, you must first master yourself" ... JP Morgan
"Most people lose money because they cannot admit they are wrong"... Martin Armstrong
http://marketvisions.blogspot.com/
#3

Posted 31 March 2014 - 12:33 AM
Gannman, here's what the chart looks like...

"Nulla tenaci invia est via" - Latin for "For the tenacious, no road is impossible".
"In order to master the markets, you must first master yourself" ... JP Morgan
"Most people lose money because they cannot admit they are wrong"... Martin Armstrong
http://marketvisions.blogspot.com/
"In order to master the markets, you must first master yourself" ... JP Morgan
"Most people lose money because they cannot admit they are wrong"... Martin Armstrong
http://marketvisions.blogspot.com/
#4

Posted 31 March 2014 - 01:30 AM
tx russ much appreciated .
feeling mellow with the yellow metal


