Jump to content


Photo

Seasonal Bias Map for November


  • Please log in to reply
No replies to this topic

#1 kssmibotm

kssmibotm

    Member

  • Traders-Talk User
  • 653 posts

Posted 02 November 2014 - 05:34 PM

Last month, there were 8 days with a strong seasonal bias -- 7 green days and one red day. Four out of the 8 seasonal bias days were winners. Had you traded UPRO and SPXU on those days, you would have ended up with a small gain for the month. I also indicated that there "could be a nasty selloff" early in October, followed by "a strong rebound rally, perhaps to new highs, beginning on the 10th and lasting through the end of the month". Although my timing was off, we did see a nasty selloff and a strong rebound in October.

http://www.traders-t...?...=156392&hl=

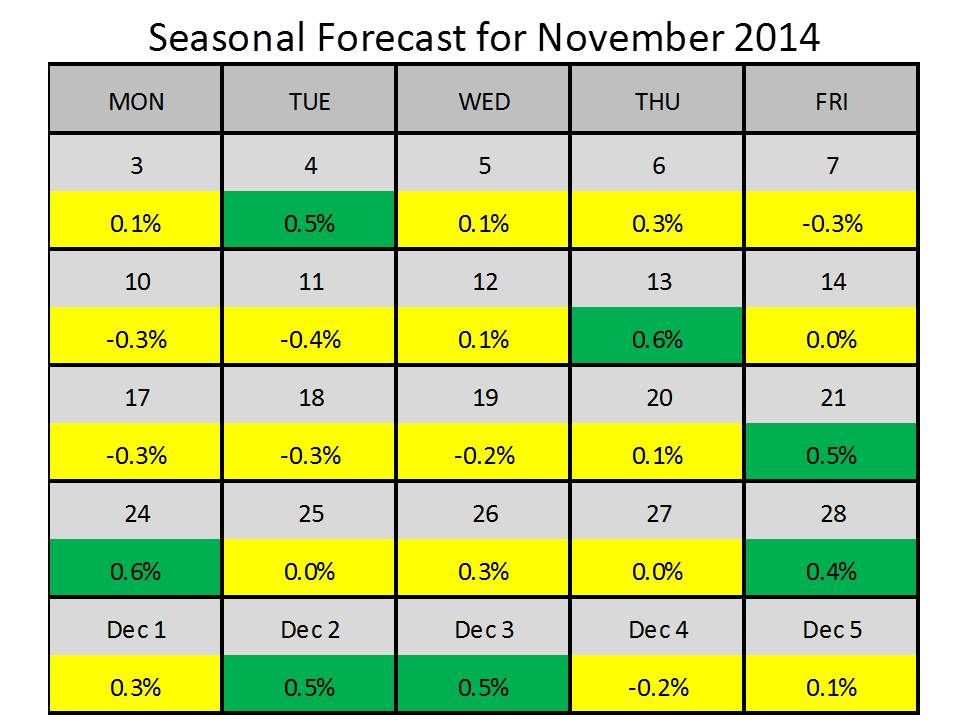
There are 5 days with a strong seasonal bias in November -- all green days. That should not surprise anyone since we are now entering the strongest 6 months in the calendar for stock prices. The only hope I can offer the bears, is a cluster of negative bias days on Nov. 7-11. Although none of the days have a strong enough bias on there own to get a red color, the clustering of those negative days suggests we could see some sort of correction to work off the overbought condition we are now seeing in the market. However, any correction in early November should be bought before Nov. 21.
Posted Image

People think the Holy Grail is something looked for but never found. In fact, it is something often found but rarely recognized.