
XOMA Corp (NASDAQ:XOMA)
Started by
Costa
, Jun 13 2015 01:48 AM
No replies to this topic
#1
: post #1")
Costa
-
- Traders-Talk User
- 660 posts
Member
Posted 13 June 2015 - 01:48 AM
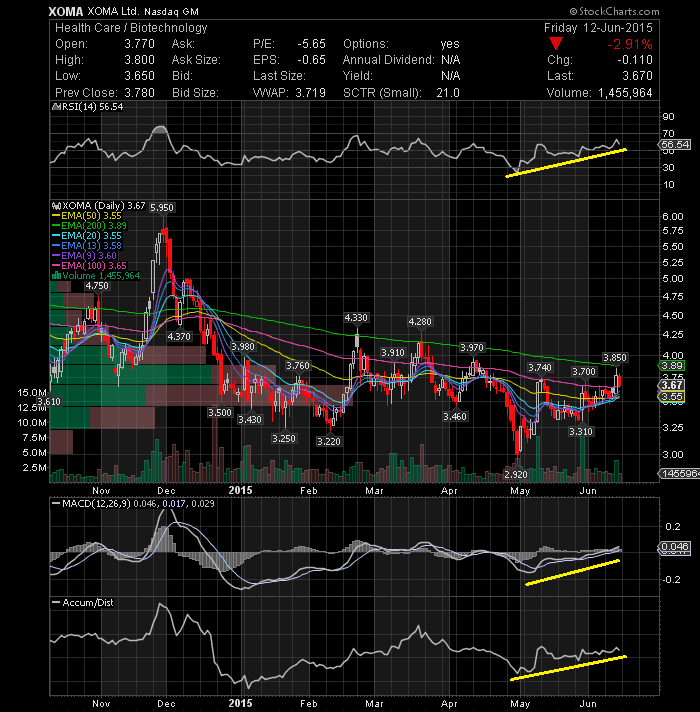
Shares of XOMA Corp (NASDAQ:XOMA) closed down 2.91% to $3.67 on low volume in Friday's regular trading session. Lets now take a look again at daily technical chart. I notice that the Accumulation/Distribution indicator still growing, which means accumulation (buying). Plus, MACD chart is still showing an up trend with the MACD indicator above its signal line and is indicating further strength. The RSI value is also currently above 50% level but it has not reached the overbought territory. If it clears resistance next week at 3.89 the move may be powerful. PS: Very high call activity has been detected.
Costa
AC Investor Blog Keep up to date by subscribing AC Investor Blog newsletter or RSS feed. You may wish to also follow me on Twitter.
AC Investor Blog Keep up to date by subscribing AC Investor Blog newsletter or RSS feed. You may wish to also follow me on Twitter.


