Everyone wants to buy at the absolute bottom in any market. Yet, most actually buy at the highs, expecting much higher prices, and then sell at the lows, while expecting even lower prices. The gold market is no different.
Back in 2011, when the metals were approaching their highs, most analysts were suggesting that investors keep buying gold as this would be their last opportunity before gold eclipses $2,000, never to look back again. Moreover, these same analysts remained bullish throughout the decline during 2012, 2013, 2014 and most of 2015. Amazingly, as we approached the end of 2015, these same analysts ultimately turned bearish, and were just as confident that gold would certainly break below $1,000 as they were confident that gold would certainly eclipse $2,000 in 2011. It truly is amazing how markets work against the masses.
Yet, in 2011, we saw that impending top coming, as we warned those following us in August of 2011:
“since we are most probably in the final stages of this parabolic fifth wave “blow-off-top,” I would seriously consider anything approaching the $1,915 level to be a potential target for a top at this time.”
Then again, at the end of 2015, we warned:
“As we move into 2016, I believe there is a greater than 80% probability that we finally see a long term bottom formed in the metals and miners and the long term bull market resumes. Those that followed our advice in 2011, and moved out of this market for the correction we expected, are now moving back into this market as we approach the long term bottom. In 2011, before gold even topped, we set our ideal target for this correction in the $700-$1,000 region in gold. We are now reaching our ideal target region, and the pattern we have developed over the last 4 years is just about complete. . . For those interested in my advice, I would highly suggest you start moving back into this market with your long term money . . .”
Moreover, we rolled out our EWT Miners Portfolio in September of 2015 to begin to buy miners we saw bottoming, in the expectation of the impending bottom to the complex.
So, as many were buying at the highs in 2011 at the urging of most analysts of the time, we were selling. And, as many were selling at the lows in 2015 at the urging of most analysts of the time, we were buying.
But, while we view the market as likely having bottomed in its long-term structure in 2015/2016, and having begun a multi-decade bull market, as I have outlined many times before, it does not mean we will be going up in a straight line. In fact, the last year and a half of sideways consolidation clearly supports this perspective.
You see, markets are not linear, so they go through periods of progression and regression. Only those who are gold bugs view gold as only supposed to be moving in one direction, whereas the only reason it could fall, in their mind, would be manipulation. And, I have addressed this view extensively in this article.
https://www.elliottw...9194206284.html
So, if we understand that the metals will naturally go through periods of progression and regression, we can maintain a much healthier perspective on the market, which can keep us grounded during both the periods of progression and regression, understanding that each has its own place in the overall structure of gold’s movement.
This brings me to the point of this article. As you probably know, I view the metals as just starting a multi-decade bull market. In fact, if you have read my analysis through the years, you would know that I view the current set up in the metals in the same manner as Ralph Nelson Elliott viewed the Dow when it was around 100 (yes, 100) back in the 1941, as World War II was raging around him, when he provided the following prognostication:
[1941] should mark the final correction of the 13 year pattern of defeatism. This termination will also mark the beginning of a new Supercylce wave (V), comparable in many respects with the long [advance] from 1857 to 1929. Supercycle (V) is not expected to culminate until about 2012.
This was probably one of the best, if not the best, market call of all time. And, as I just noted, I view the set up in the mining complex in the same way Elliott viewed the Dow back in 1941.
But, again, I do not view this impending bull market as moving in one direction all the time. Rather, we will have periods of progression and regression. While I expect the next period of progression to begin quite soon, I feel that you may be able to keep your FOMO (Fear Of Missing Out) in check for a few more years, even though it may be tested later this year in 2018.
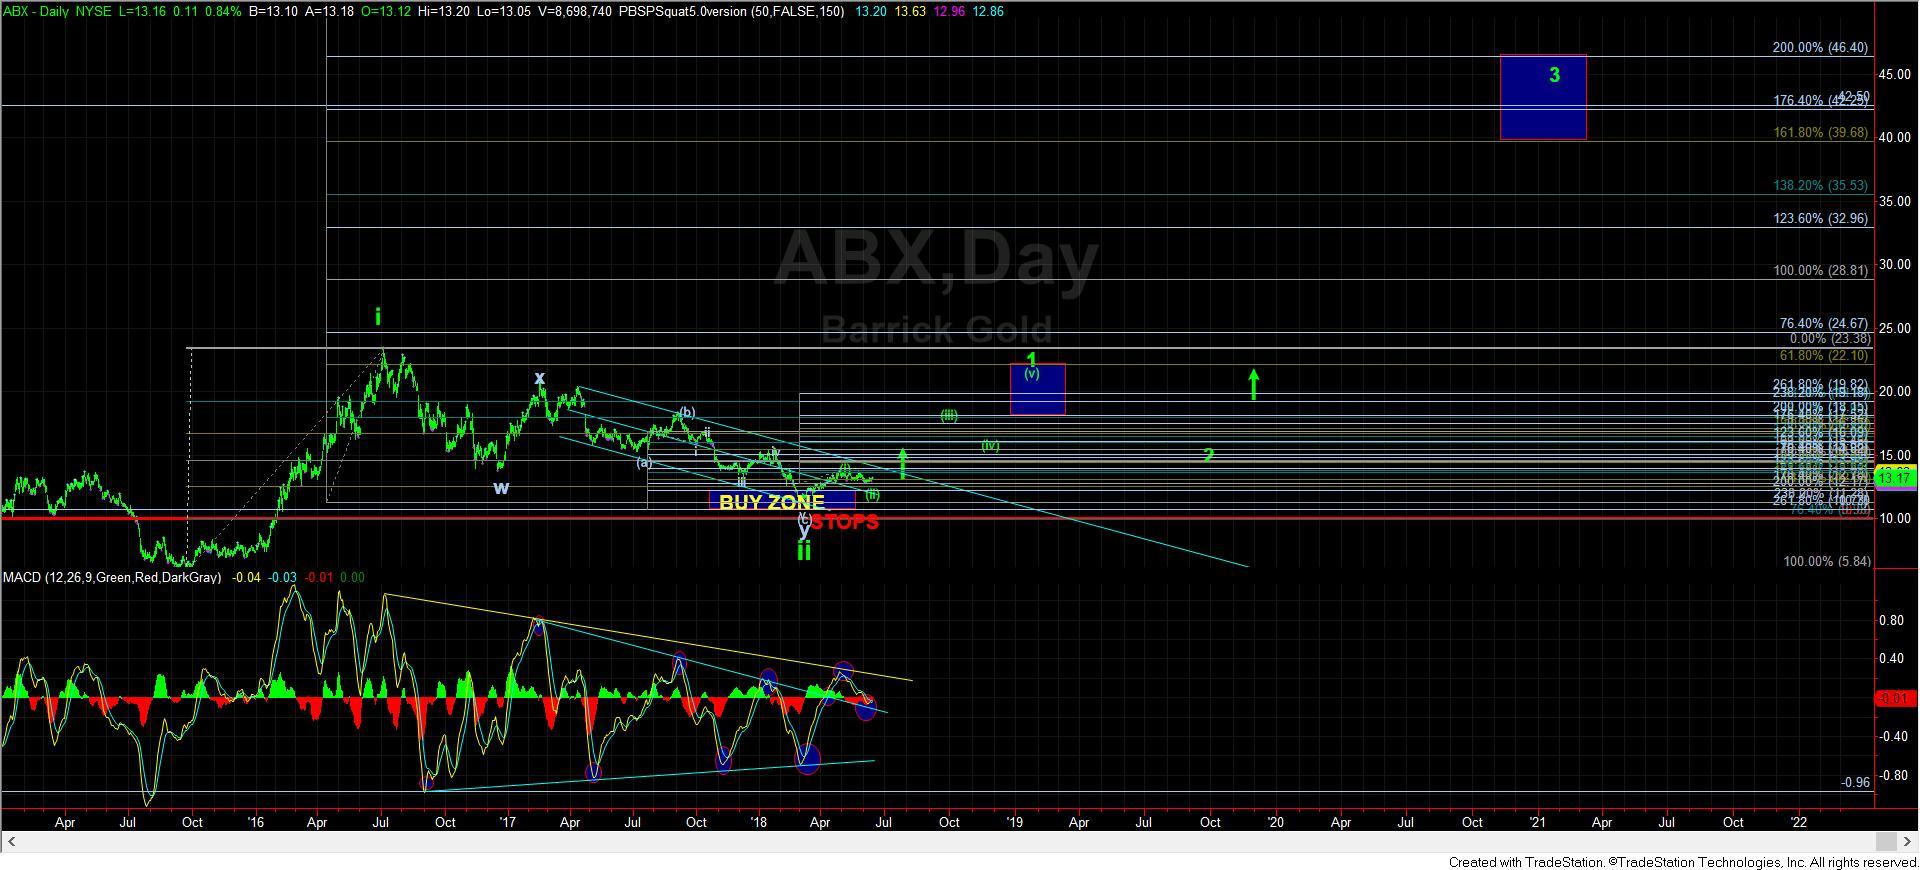
I would like to explain this perspective through the use of the daily ABX chart. As we all know, the ABX is arguably the leading mining company in the metals complex. So, I view it as providing a nice perspective regarding the potential progression and regression I see over the coming years in some of the larger miners.
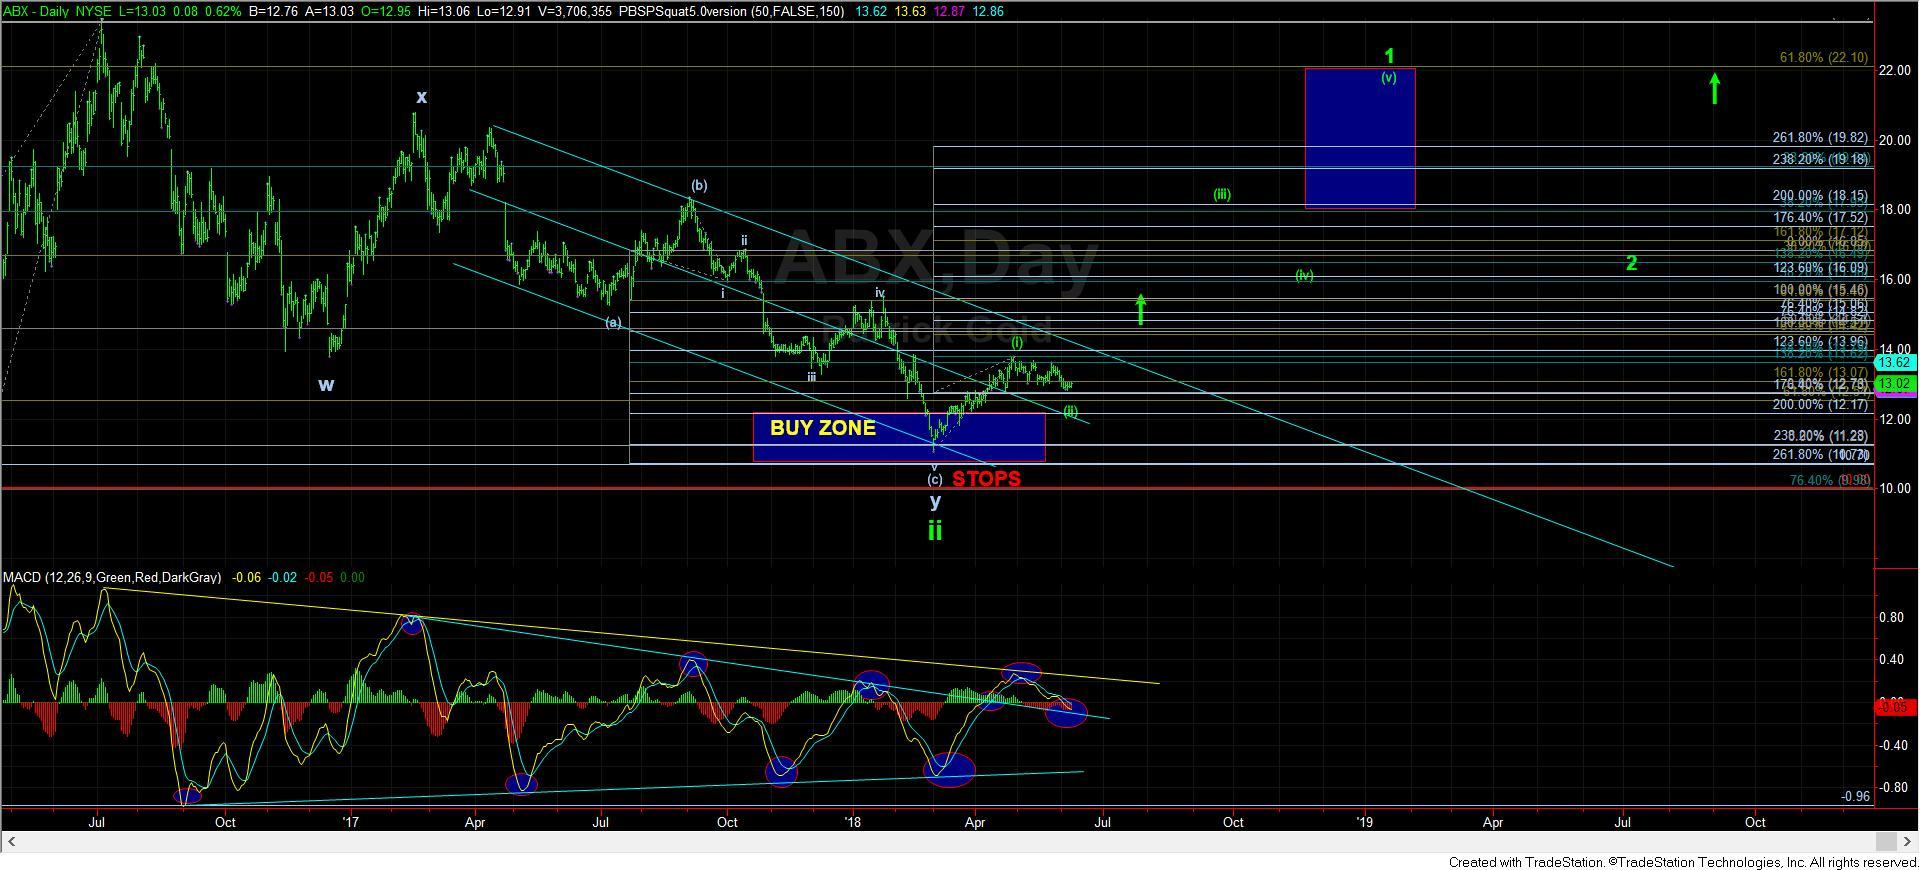
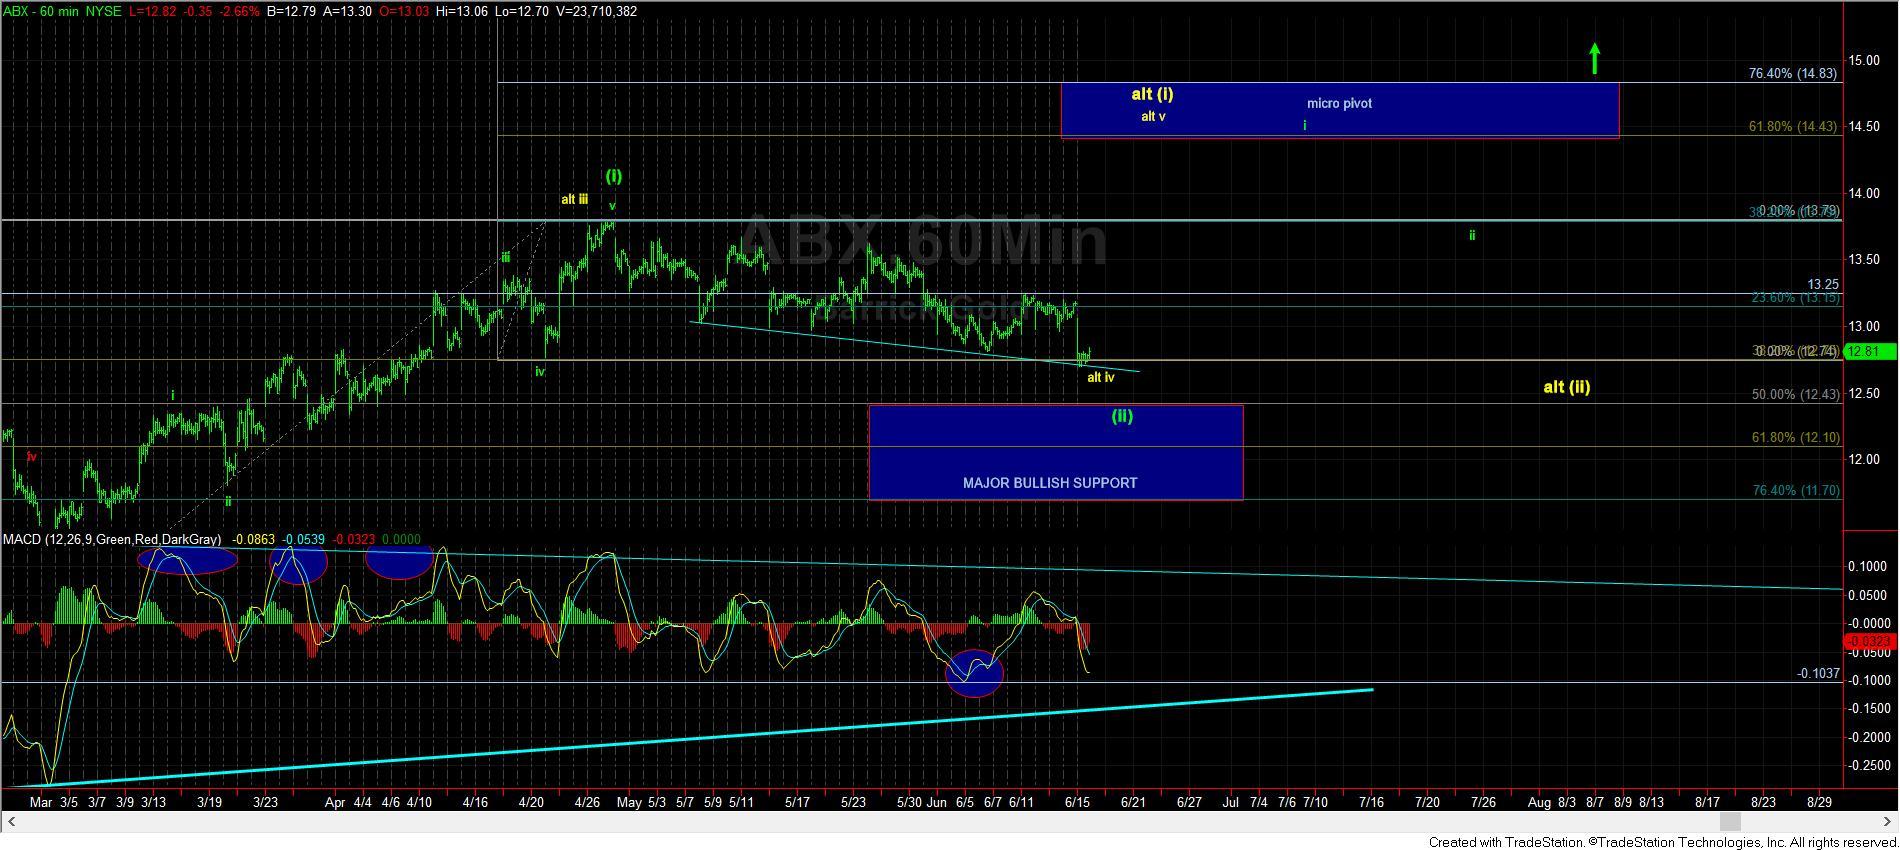
As we can see, we have completed an initial 5 wave structure off the 2015 low in the ABX into the high of the summer of 2016. Since that time, we have pulled back in a very corrective, overlapping 2nd wave. Currently, I believe we are still working on the wave 1 of iii off the recent lows which we caught in our secondary “buy zone.” Based upon the current structure, it would suggest that it will take the rest of 2018 to complete this wave 1 (assuming we hold the bullish support highlighted on the 60-minute chart).
After we complete this wave 1 into the 20-22 region, I would assume we will see another long pullback in wave 2 during 2019 towards the 14-17 region. This would then likely set us up for a major break out in 2020, which will likely be pointing to at least the 40-46 region, with the potential to extend as high as the 57 region, depending upon extensions. And, that would only be for wave 3 of iii off the 2015 lows.
So, as you can see, while there can be some nice upside which we still expect in 2018, the real fireworks seem to be setting up for 2020 in the ABX, which we may be able to extrapolate to the rest of the complex.
This means that, while you will likely feel serious FOMO on the next rally that we expect can take hold into the end of 2018, you will likely have one more pullback/buying opportunity in 2019 before the main event takes hold in 2020.
As we continue to focus on the smaller degree time frames during the week, and as we track the next smaller degree break-out set up, I think it may benefit many of you to take a deep breath and focus on the larger perspectives in the market from time to time. While I believe we are setting up a major move in the mining complex in the coming years, I think the ABX shows us that the major money may not be made until 2020 and beyond.
So, for those of you who have been stressing during this last year and a half consolidation in the market, I have three words for you:
TAKE A CHILL!