First published Sun Jul 1 for members of ElliottWaveTrader.net: Dealing with markets is more about psychology than it is about anything else. So, let’s begin this weekend’s analysis with a discussion of the psychology of the metals market.
There has been no trade more frustrating over the last several years than the metals. In fact, if you even remember back in 2015, the low we struck at the end of the year was at the completion of a year-long ending diagonal, which itself caused a great deal of frustration. So, to put this market action into perspective, within the last 42 months, we have spent approximately 32 of those months in overlapping and frustrating structures.
So, if you are wondering why people are so frustrated with the metals market, wonder no longer. When you put the long-term price action into perspective, it is quite easy to understand why investors are so frustrated at this point.
Yet, consider the other side of the coin (sorry about the pun). As I tell people, back at the end of 2015, I opened separate accounts for my children with the sole intent of buying them mining stocks with a long-term hold perspective. That was the only purpose I had for these particular accounts. These accounts are still up over 100% since that time. Now, if you can take a step back from your frustration, consider what other investment has returned 100% in the last 3 years?
One of our responsibilities as traders and investors is to do our utmost to suppress our emotions. When you approach a market with emotion, you are doing yourself an immense disservice. So, when I see some of you post your frustration with the metal’s price action, while I understand where it is coming from, I urge you to try to suppress it better.
Believe me, I am just as frustrated, and arguably even more frustrated than are you. I, too, have been heavily invested in the metals market since the end of 2015. More importantly, I take quite seriously the immense responsibility I have to the 3500+ people who follow my analysis on metals within my subscription services, along with tens of thousands or more who read my public articles. And, I do understand how difficult it is to look at the charts in a dispassionate way. But, it MUST be done in order to gain the most honest perspective about the market, as “hope” is the most destructive four-letter word you will find in financial markets.
When I see an year-long ending diagonal complete into the end of 2015, followed by one of the strongest impulsive rallies seen in the metals complex in a long time, my analysis tells me that it is highly likely we have struck a long-term bottom, based upon that action alone. Remember, when the market completes an overlapping ending diagonal, it will most often see a violent change of trend take it back to the point at which that ending diagonal began. And, that is what we saw in 2015 and 2016. Moreover, we even prepared our members for that rally, as we identified that bottoming region long before we even struck that bottom, and rolled out our EWT Miners Portfolio at the end of 2015 in preparation for that bottom.
So, when I now take a step back and look at the chart with that perspective in mind, my analysis tells me that it is still highly likely that a long-term bottom has been struck based upon the action seen in 2015 and 2016. And, yes, that does not change even though we are all very frustrated by the price action we have seen since that time.
Moreover, most of the price action since we struck that rally high in mid-2016 has been corrective in nature. Again, from a purely analytical standpoint, this should cause me to reinforce my perspective that a major low was likely struck at the end of 2015, and view the market as simply biding its time until its next explosive move higher, which has the potential of being even stronger than the move seen in early 2016.
Now, from time to time, I will get questions, especially from newer subscribers, who present me some other analysts “corrective” count for the rally off the 2015 lows. In fact, it makes for quite an interesting observation about market sentiment that these questions are most often presented to me when the market has been dropping.
But, in order to adopt a corrective count off the 2015 lows, you would have to accept a c-wave within such “corrective” rally as only attaining .618-.764 the size of the a-wave. Based upon my experience in the metals complex, c-waves are RARELY, if ever, less than the size of a-waves, and are often larger than the a-waves. Moreover, based upon the standards we follow, the proportions the market exhibited for the rally off the 2015 lows are strongly indicative of 5-wave structures rather than corrective structures, as 5thwaves in an impulsive structure will usually equate to .618-.764 the size of the first 3 waves within a 5-wave structure. So, again, the structures we have seen are much more indicative of impulsive structures rather than corrective ones.
This then leads to the next question which most often follows: Is it “possible” that the initial rally off the 2015 low was an a-wave in a larger degree corrective rally? My answer has always been that it is certainly “possible.” But, just like my answer in the first question, I don’t see it as the higher probability. In fact, there are very few a-waves I come across that are 5-wave structures, as the great majority of them are 3-wave structures in my experience.
So, I ask you, based upon what we know about Elliott Wave analysis, when we look at the bigger picture, should I be maintaining a bullish or bearish overall bias of the market? While we certainly can be wrong in our assessment, as we only deal in probabilities and not certainties, the question you need to ask yourself is if you need to be looking at the market through bullish glasses or bearish glasses from a probabilistic perspective? Remember, this is the same analysis methodology we used to catch the highs in 2011 and the lows in 2015, while most everyone else at the time was strongly looking in the opposite direction that we were. Should we change our standards for analysis because everyone is “frustrated?”
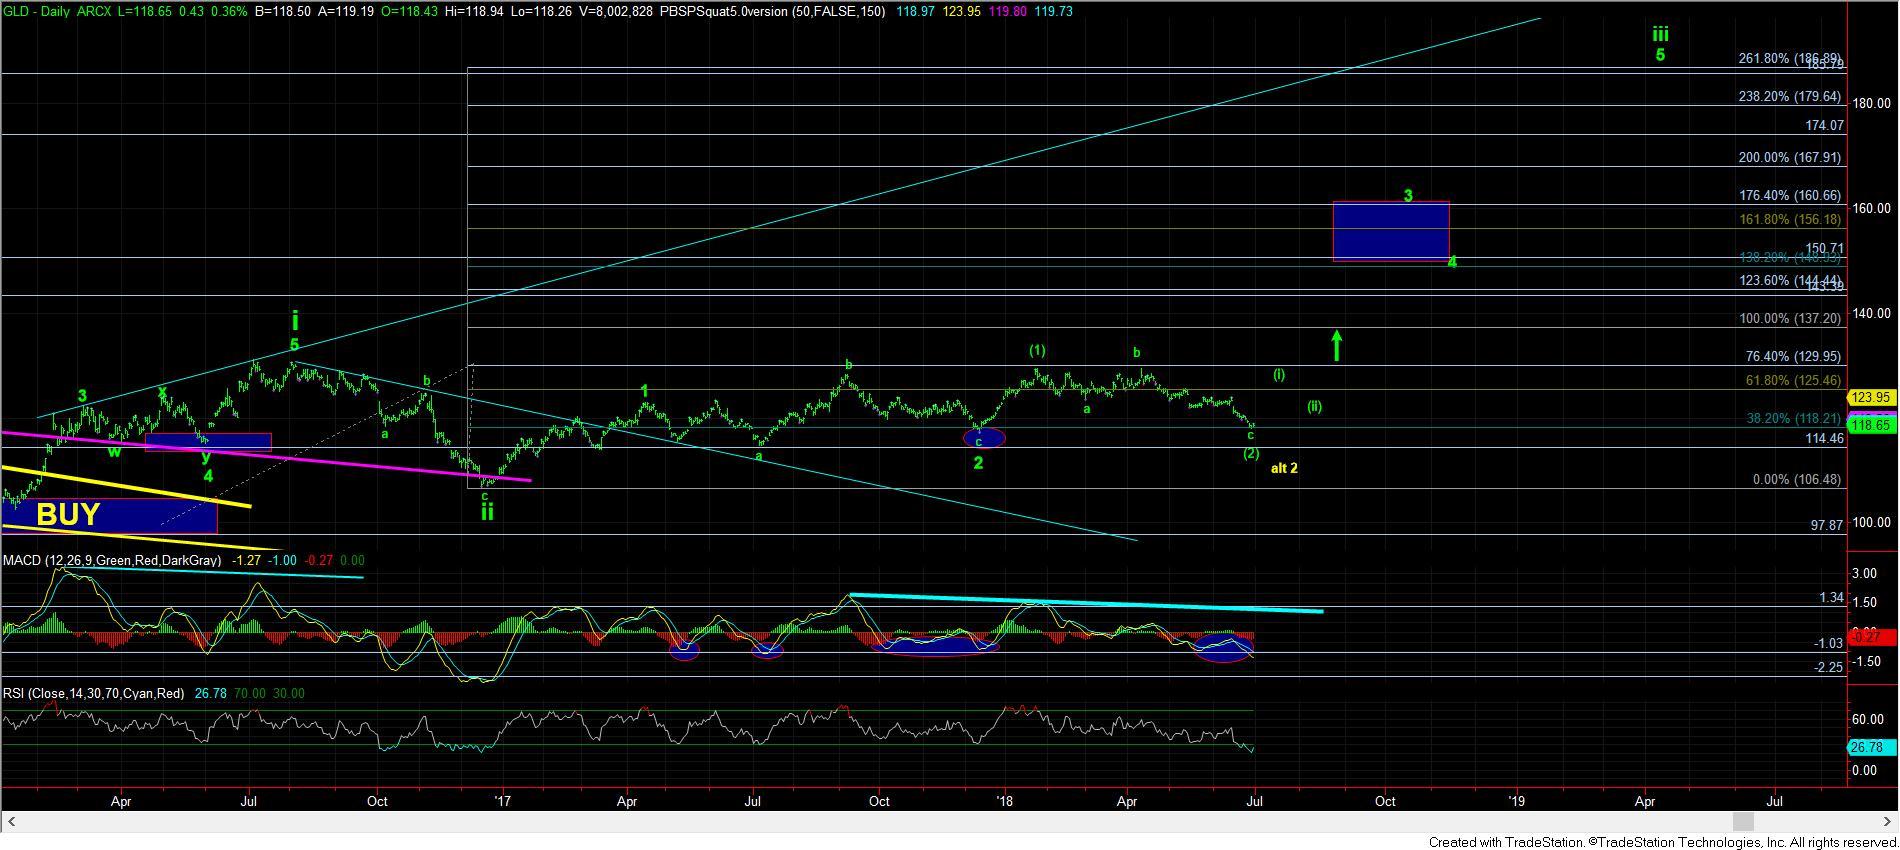
The market on the smaller degree level has certainly developed a very bearish tone. And, those that are not outright bearish at this point in time are beyond frustrated and disgusted by the price action we have seen for years. Yet, the smaller degree bullish set up has not invalidated this past week, despite the GLD dropping a bit lower than I had preferred. But, it did so at the bottom of wave ii at the end of 2016 as well, and we were certainly hearing the same perspectives at that time that we are hearing today.
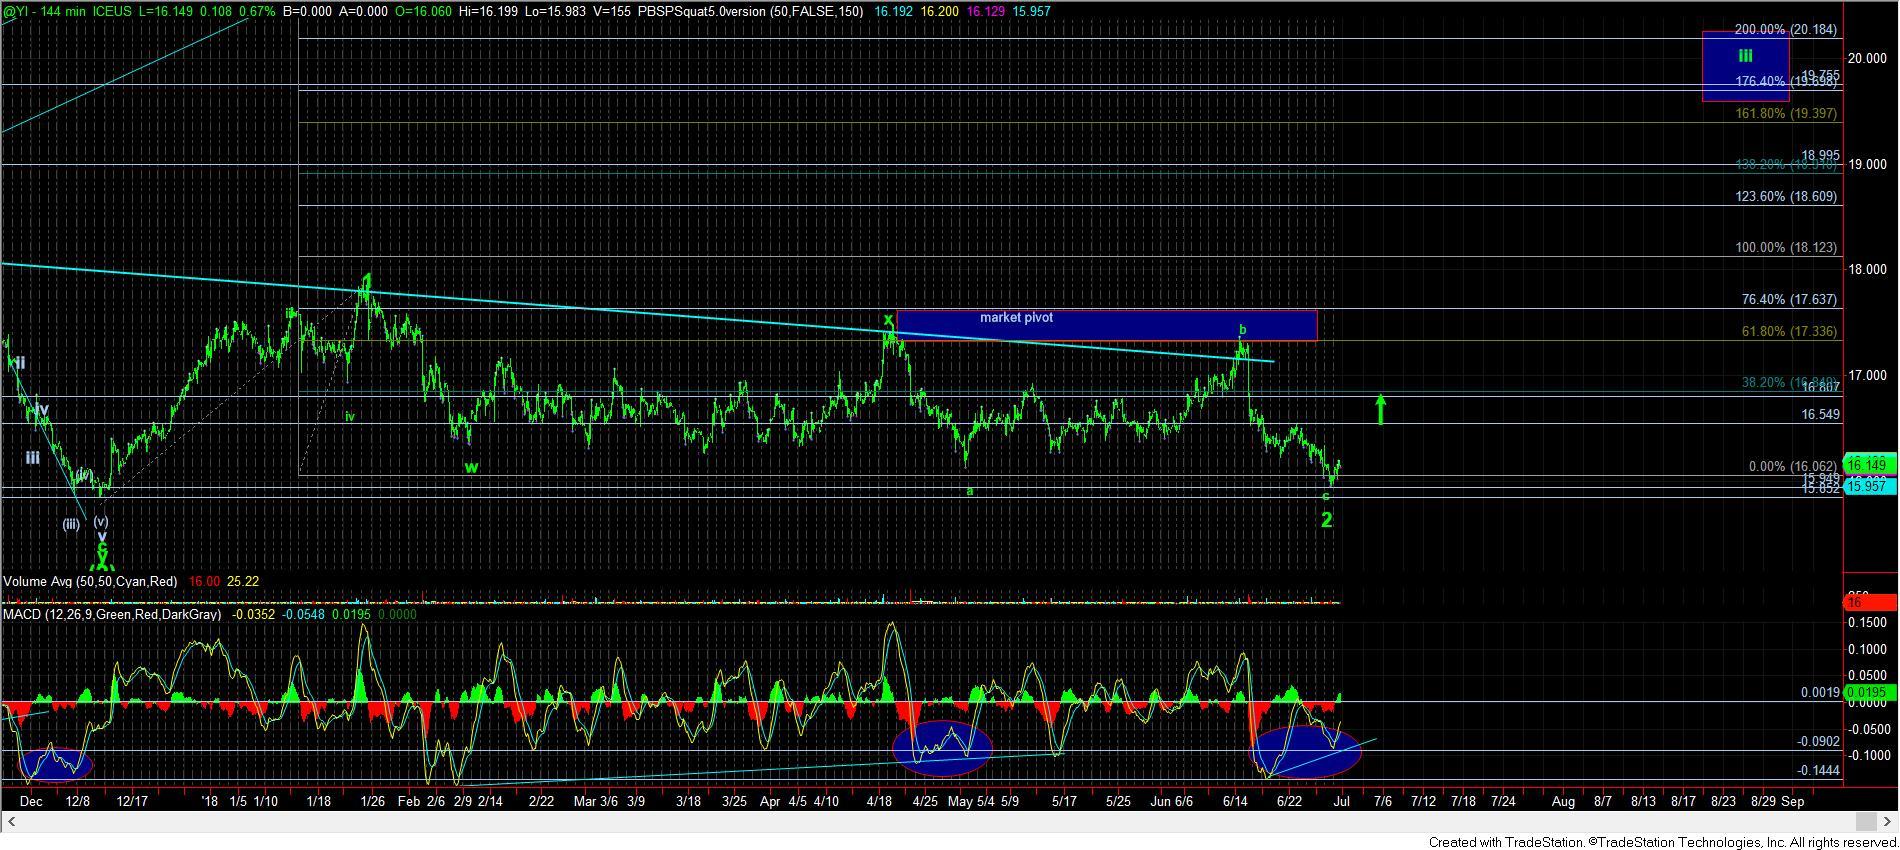
In fact, silver held the level it needed to hold to the penny this past week – 15.95, wherein we seem to have completed a 5 wave c-wave exactly into that a=c target. If we can rally through the 16.55 level next in an impulsive fashion, that would turn me quite strongly bullish. Yet, remember, even GLD still needs another (i)(ii) structure before we will be on “break-out” alert. But, so far, it too has not invalidated its wave (2) potential count.
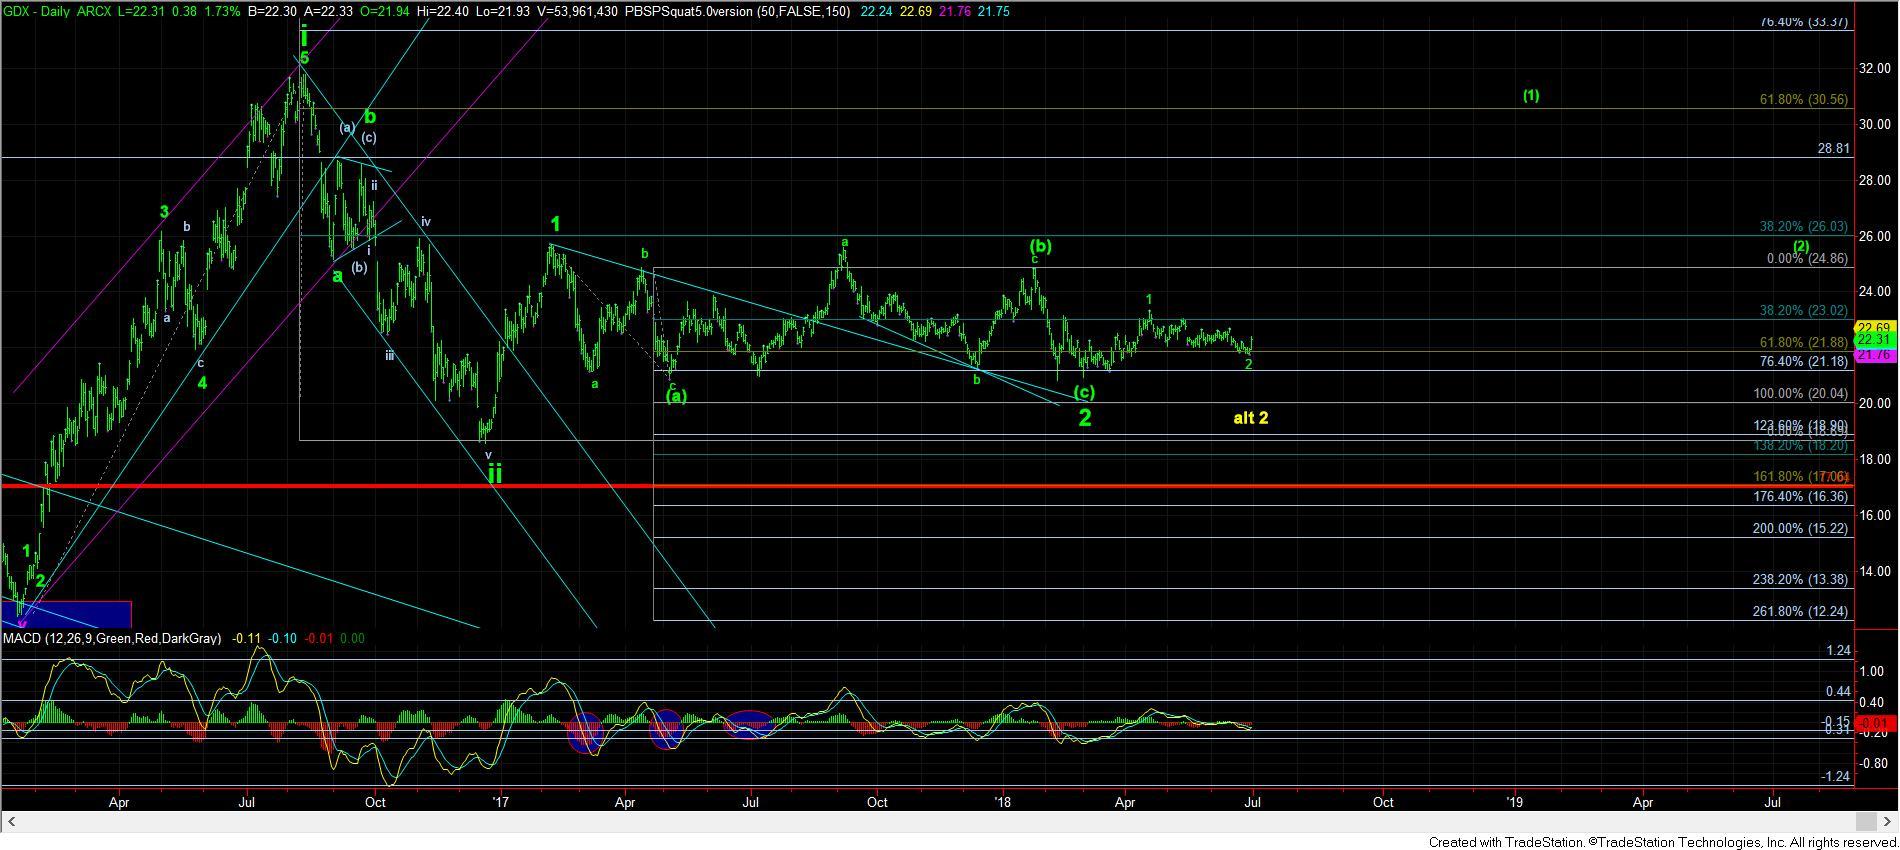
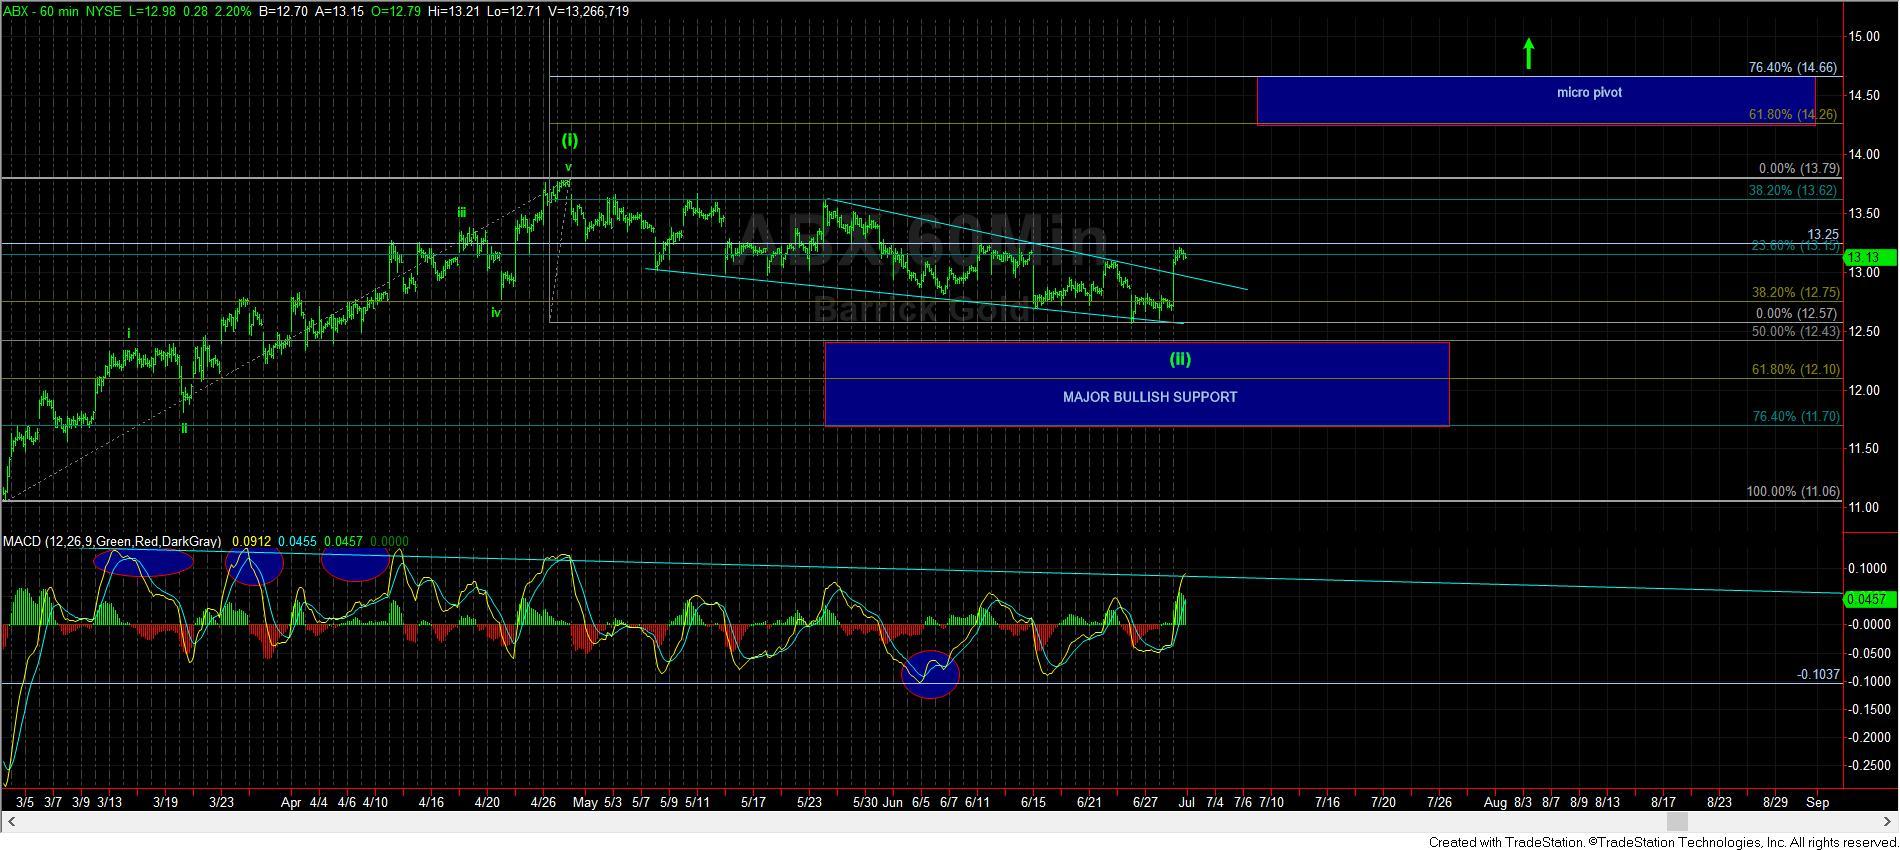
Moreover, GDX and a number of the miners we follow have not pulled back anywhere near as far as one would have expected with this weakness in gold. In fact, if you look at the ABX chart below, we almost have a micro 5 waves up off support. And, that is after we have seen an impulsive move off the lows we caught several months ago, after which, the market has pulled back in a corrective and overlapping manner. Again, these are generally bullish indications.
So, while it has certainly been frustrating these last 42 months in this complex, with only 25% of that time actually seeing impulsive structures, the bigger picture tells me that I need to continually give the bulls the benefit of the doubt, even though they have only been in charge of the market 25% of the time. You see, the next time they fully take charge, we will likely see a rally that most will not believe and will not benefit from, despite the potential for it to be even stronger and larger than what we experienced in 2016.
Lastly, as I have done for years, I will continue to warn about using leverage too early on. As I have said continually for years, and even repeated it at least once every 3 months, please refrain from using the leveraged ETF’s or options until the market proves its break out. For those that have not heeded my warning about this, the time decay caused by this extended corrective action has certainly been detrimental to your positions. So, only when the heart of the 3rd wave proves itself to be ready should one utilize aggressive strategies. And, anyone who has heeded my warnings about this is likely still well profitable since we began buying this market aggressively at the end of 2015.
Clearly, the next week will be very important for the metals to continue to “bounce” off the lows struck at the end of this past week. But, should GLD be unable to continue its rally, and break below 117.40, it will likely take many more months before it resurrects its (1)(2) structure. So, clearly, holding last week’s low is quite important to seeing a larger degree break out begin sooner rather than later.
But, remember, that does not mean I am bearish this complex even if we break below last week’s low, at least from the larger degree perspective. While it certainly can open the door to drop as deeply as the 107 region before the next micro impulsive structure is resurrected, the overall sentiment readings I am seeing, along with the anecdotal sentiment I am seeing, do not seem to support such a large drop at this time.
It’s up to you now Mr. Market. We have no choice but to wait patiently and remain as dispassionate as possible.