Lotta people thinking this way including me, lol, can't be good.
dharma, any comments on the current astro?

Member

Posted 20 January 2019 - 04:18 PM
Lotta people thinking this way including me, lol, can't be good.
dharma, any comments on the current astro?
Member

Posted 20 January 2019 - 06:46 PM
IMO the wave count in gold looks soon to be bullish because I believe the count from the highs is a sharp wave A down from 1298.54 on Jan 3 to 1276.66 on Jan 4, from there a nice and I think clear wave B contracting tri with wave "e "ending at the Jan 17 high at 1295.33, since then a thrust down appears underway and a 5-wave decline below 1276.66 is needed to complete the pattern, near term charts IMO suggest one or two more hourly subdivisions lower could complete the pattern below 1276.76. Looks like a pretty nice and fairly high confidence pattern to me, we see
Senor
Member
Posted 21 January 2019 - 09:39 AM
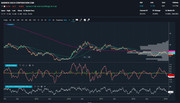
Like this?
Si and eggxactly. My only possible quibble with that count you posted is where u have wave "I", 50/50chance it may have been the bottom just before and we need one more 4/5, in any case IMO we could be at or near that corrective bottom.
Senor
Member

Posted 21 January 2019 - 09:59 AM
GOLD chart is pretty typical of the entire sector....pretty obvious what needs to happen for bulls to take control again...above the massive volume by price bar again, and a close back above the 900 day MA, and bull likely out of the chute.
Absolutely massive pivot just set.....
Breakout could be days away....or a lot longer....
Until then, bears still roaming....
Edited by K Wave, 21 January 2019 - 10:08 AM.
The strength of Government lies in the people's ignorance, and the Government knows this, and will therefore always oppose true enlightenment. - Leo Tolstoy
Member
Posted 21 January 2019 - 11:47 AM
GOLD chart is pretty typical of the entire sector....pretty obvious what needs to happen for bulls to take control again...above the massive volume by price bar again, and a close back above the 900 day MA, and bull likely out of the chute.
Absolutely massive pivot just set.....
Breakout could be days away....or a lot longer....
Until then, bears still roaming....
i agree w/you the outside candle in the gdx resolved to the upside , but then the gdx got smashed again. this outside day candle in gold on huge volume needs resolution. if the bulls dont pick up the ball , the market could get ugly. the downtrend from the 11 high comes in on the monthly @1300 resistance. that also needs to be taken out. imo a critical juncture. full moon eclipses have a history of being bearish for the stock market w/in a few days. does the sector need a complete washout? has the bull returned.? the market has left me w/questions
dharma
1235is the mid point of the rally
whats interesting to me is as price softened gold holdings increased
Edited by dharma, 21 January 2019 - 11:55 AM.
Member

Posted 21 January 2019 - 02:06 PM
yep interesting juncture here. Down favored but not by much
Member
Posted 21 January 2019 - 10:28 PM
Like this?
Si and eggxactly. My only possible quibble with that count you posted is where u have wave "I", 50/50chance it may have been the bottom just before and we need one more 4/5, in any case IMO we could be at or near that corrective bottom.
Senor
looks like one more 4/5 down below 1276.66 IF the bullish count is correct, lets see if that occurs overnight and we get a bottom, key near term action IMO
Senor
Member
Posted 22 January 2019 - 10:19 AM
Senor, does the double bottom (A and C) cut the mustard or do you need it to go below?
The 5 waves down look complete to my untutored eye.


