Record volume on SLV...........not good!

out on a limb! bottom for wave 2 in !?
Started by
dharma
, Jun 03 2019 10:55 AM
1010 replies to this topic
#711

linrom1
-

- Traders-Talk User
- 4,045 posts
Member
#712
dharma
-
- Traders-Talk User
- 9,625 posts
Member
Posted 06 September 2019 - 02:12 PM
yes, gold took out its 16 highs miners have not. the miners got hit much harder than gold from the 16 highs forward.its why i pound on the table that miners are inexpensive. in fact historically they are cheap
golng out to the 120,90yr cycles and shorter term point to the stock market having an event in this period out to november. in my limited experience of 41 years i have never seen a stock market crash that didnt suck everything else w/it. so my strategy is to have some cash for such an opportunity. the event can occur any time now. this event will cause panic by the powers that be and that will set the stage for the stagflation that i see coming i believe that we will see a real bull market in miners. which wasnt seen in the advance from 99-11 . miners will be the go to investment
dharma
heads up
#713
jabat
-

- Traders-Talk User
- 606 posts
Member
Posted 06 September 2019 - 06:03 PM
Senor
This silver chart is by cdelaney from other forum
. He is still looking for wave 4 bottom then a Wave 5. You have been recently concentrating on silver and silver etfs. Your input will be appreciated.

#714
linrom1
-
- Traders-Talk User
- 4,045 posts
Member
Posted 06 September 2019 - 07:08 PM
Sentiment is still very bullish: few shorting, most just waiting for price to fall so they can buy more!
#715
dougie
-

- Traders-Talk User
- 9,075 posts
Member
Posted 07 September 2019 - 01:50 AM
gold seems to have put in a pretty clear 5 wave move off the highs on hourly...
what to make of that?
#716
gannman
-

- Traders-Talk User
- 6,948 posts
Member
Posted 07 September 2019 - 04:01 AM
the xau went from 65.88 to 102.29 for a total of 36.41 points close to a fib 34
=
it went from may 28 to august 28 close to a fib 89 days
the .382 retrace of the move = 88.39
we closed at 94.26
feeling mellow with the yellow metal
#717
AChartist
-

- Traders-Talk User
- 5,800 posts
Tim
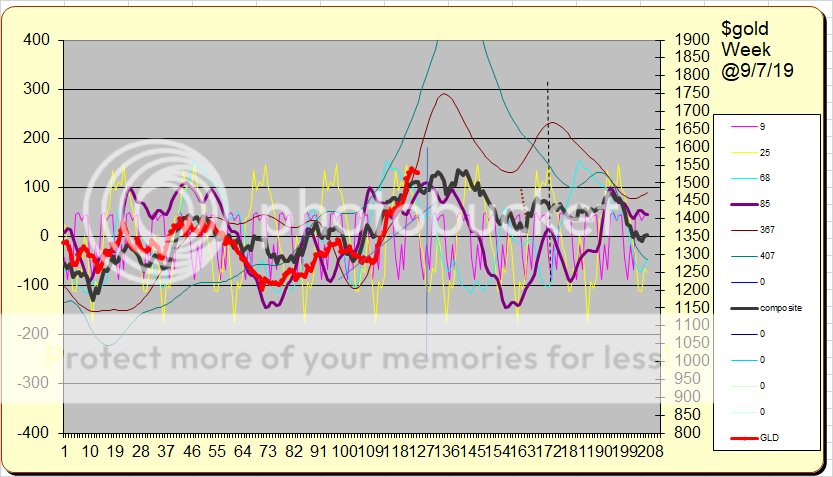
Posted 07 September 2019 - 08:16 AM
The weekly, there can be an intervening bounce in the 9 week cycle in two weeks,
and those two hyperbolic cycles may take hold from there.
There is another lowpoint in the 25 week and the next 9 week cycle low in 10 weeks. So if you dont get what you want after 2 weeks it might
wait for the parabolics to work after 10 weeks. I hope it will work between 2 and 10 weeks.
I added just a few hundred to two 401k gold funds on Friday and will bigger one more time in two weeks because you really cant predict
when or if the parabolics will hit for example you dont take sell signals in a bull mkt.
But to look at line on close from 10000 feet, its only a 1 of 3 of 3 possible?
Edited by AChartist, 07 September 2019 - 08:16 AM.
"marxism-lennonism-communism always fails and never worked, because I know
some of them, and they don't work" M.Jordan
#718
Smithy
-

- Traders-Talk User
- 2,303 posts
Member
Posted 07 September 2019 - 02:50 PM
Tim, could you put some dates on the lows on your chart? It looks good.
#719
Russ
-

- Traders-Talk User
- 7,204 posts
Member
Posted 07 September 2019 - 03:44 PM
The weekly, there can be an intervening bounce in the 9 week cycle in two weeks,
and those two hyperbolic cycles may take hold from there.
There is another lowpoint in the 25 week and the next 9 week cycle low in 10 weeks. So if you dont get what you want after 2 weeks it might
wait for the parabolics to work after 10 weeks. I hope it will work between 2 and 10 weeks.
I added just a few hundred to two 401k gold funds on Friday and will bigger one more time in two weeks because you really cant predict
when or if the parabolics will hit for example you dont take sell signals in a bull mkt.
But to look at line on close from 10000 feet, its only a 1 of 3 of 3 possible?
Tim, We are seeing the same thing, a big low in about 10 weeks, I have around Nov 11 for the low on GDX, but the Gold chart is suggesting a little farther out than that. Another chartist. ")
Edited by Russ, 07 September 2019 - 03:45 PM.
"Nulla tenaci invia est via" - Latin for "For the tenacious, no road is impossible".
"In order to master the markets, you must first master yourself" ... JP Morgan
"Most people lose money because they cannot admit they are wrong"... Martin Armstrong
http://marketvisions.blogspot.com/
"In order to master the markets, you must first master yourself" ... JP Morgan
"Most people lose money because they cannot admit they are wrong"... Martin Armstrong
http://marketvisions.blogspot.com/
#720
AChartist
-
- Traders-Talk User
- 5,800 posts
Tim
Posted 08 September 2019 - 05:48 AM
Tim, could you put some dates on the lows on your chart? It looks good.
Here are dates, I wouldn't count on much of it until we see if the high cycles work between 2-10 weeks. And if they do work it
could start right translating and wont find a top but can still work to anticipate the low in 9-10 months.
https://i1129.photob...zpsgzqnmbsg.png

Edited by AChartist, 08 September 2019 - 05:49 AM.
"marxism-lennonism-communism always fails and never worked, because I know
some of them, and they don't work" M.Jordan


