For those interested, you can read the full article on my blog or on LinkedIn:
http://milehighguyll...actal-symmetry/
https://www.linkedin...igh-strategies/

Member
Posted 19 January 2020 - 12:53 PM
For those interested, you can read the full article on my blog or on LinkedIn:
http://milehighguyll...actal-symmetry/
https://www.linkedin...igh-strategies/
Member

Posted 19 January 2020 - 02:03 PM
this chart gives me a clearly defined projection to 36000
https://www.tradingv...com/x/e31rpvFJ/
the correction above and below 26000 is a running correction of the advance that started near 16000 and is the half way point of the entire move....in other words the length of any move is twice the distance from the middle to either end
Member

Posted 19 January 2020 - 04:00 PM
Member
Posted 19 January 2020 - 06:49 PM
TSharp
Good Stuff
Enjoyed reading it
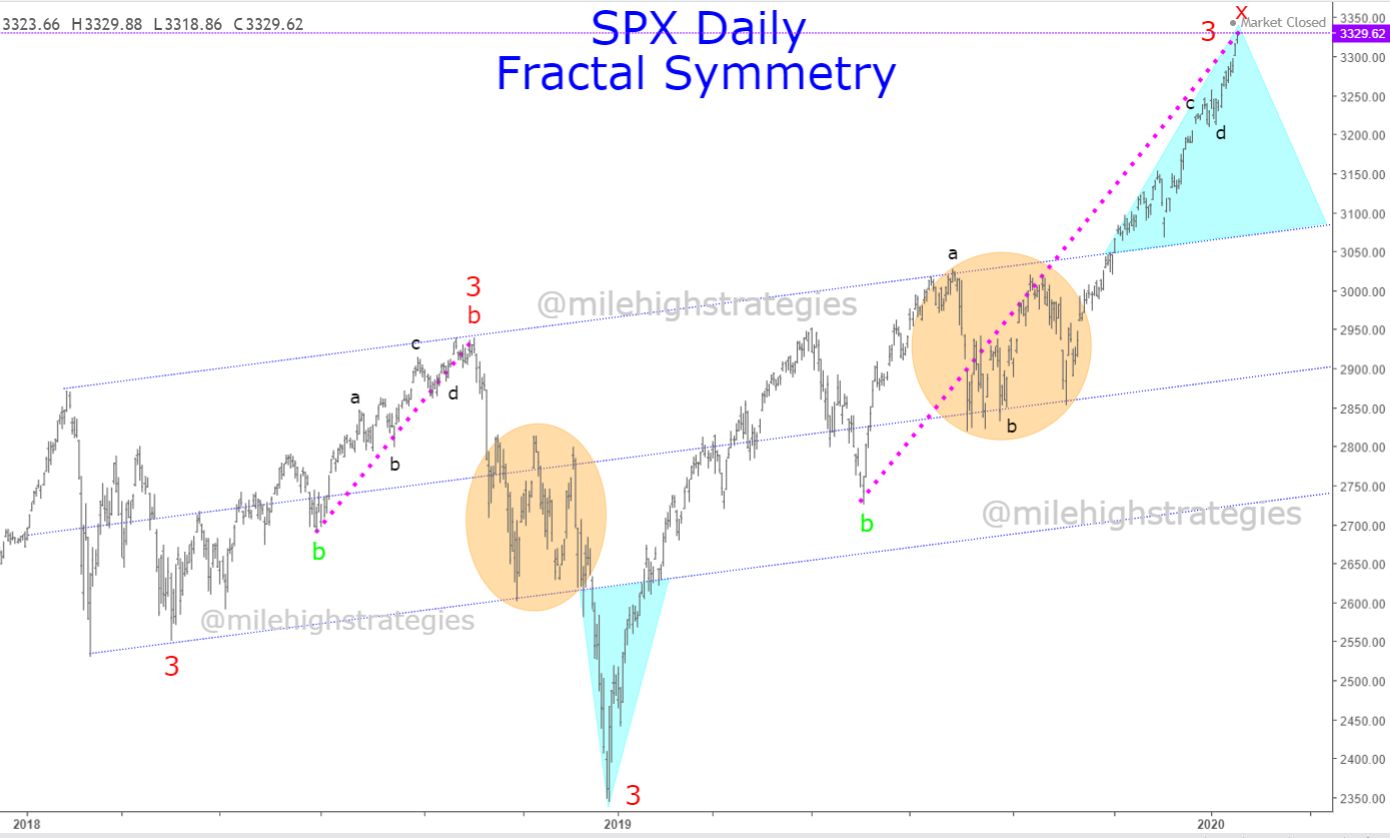
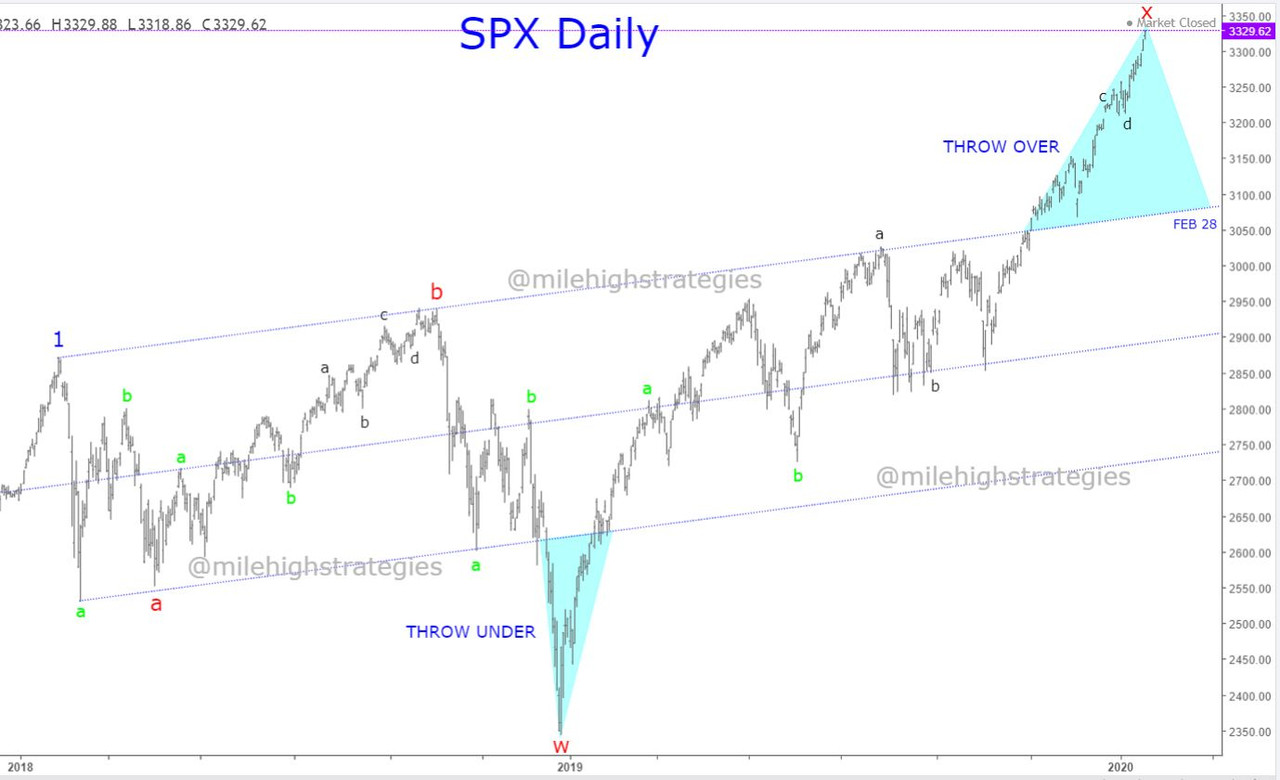
To add - the rally from October 19 low to to the top this past Friday is just short of .786 of the rally from December18 thru May 19.
If the consolidation from May 19 thru October 19 low was a triangle, the price projection was reached on Friday.
The SP500 closed above Weekly Bollinger, not just the daily.
I disagree with the next decline finishing Wave 2 from January18 but I can see it finishing Wave 2 from October18 this is just the very Top from 2009.
But thats immaterial right now. Short to intermediate term, it certainly seems like a turn down is near. Of course Ill adjust if need be.
I can't add everything I post, but actually, the BB close was a trifecta, daily, weekly and monthly... and the last time both the weekly and monthly closed above their respective upper BBs was the week they peaked in Jan 2018.
Member
Posted 19 January 2020 - 08:07 PM
blustar

Posted 20 January 2020 - 12:36 PM
My read is: yes, it has the look of Jan 26, 2018, but the astro-cycle drop coming looks more like Oct 3-29, 2018 from Jan 17-Feb 13. A hybrid or more?
Member
Posted 20 January 2020 - 03:49 PM
as history has shown looking back and comparing price structure to what happened before is a complete waste of time ....especially in this once in a lifetime never seen anything like it move
Member
Posted 20 January 2020 - 05:29 PM
as history has shown looking back and comparing price structure to what happened before is a complete waste of time ....especially in this once in a lifetime never seen anything like it move
If you mean looking back to the origin of a corrective fractal that began in Jan 2018, a double zig zag wave-2, off the 2009 lows, that could be complete by June, then I guess I need a lot of help... I wish you all much profitable trading!!!
Member

Posted 20 January 2020 - 05:42 PM
very interesting tsharp, thanks!
Member
Posted 20 January 2020 - 06:23 PM
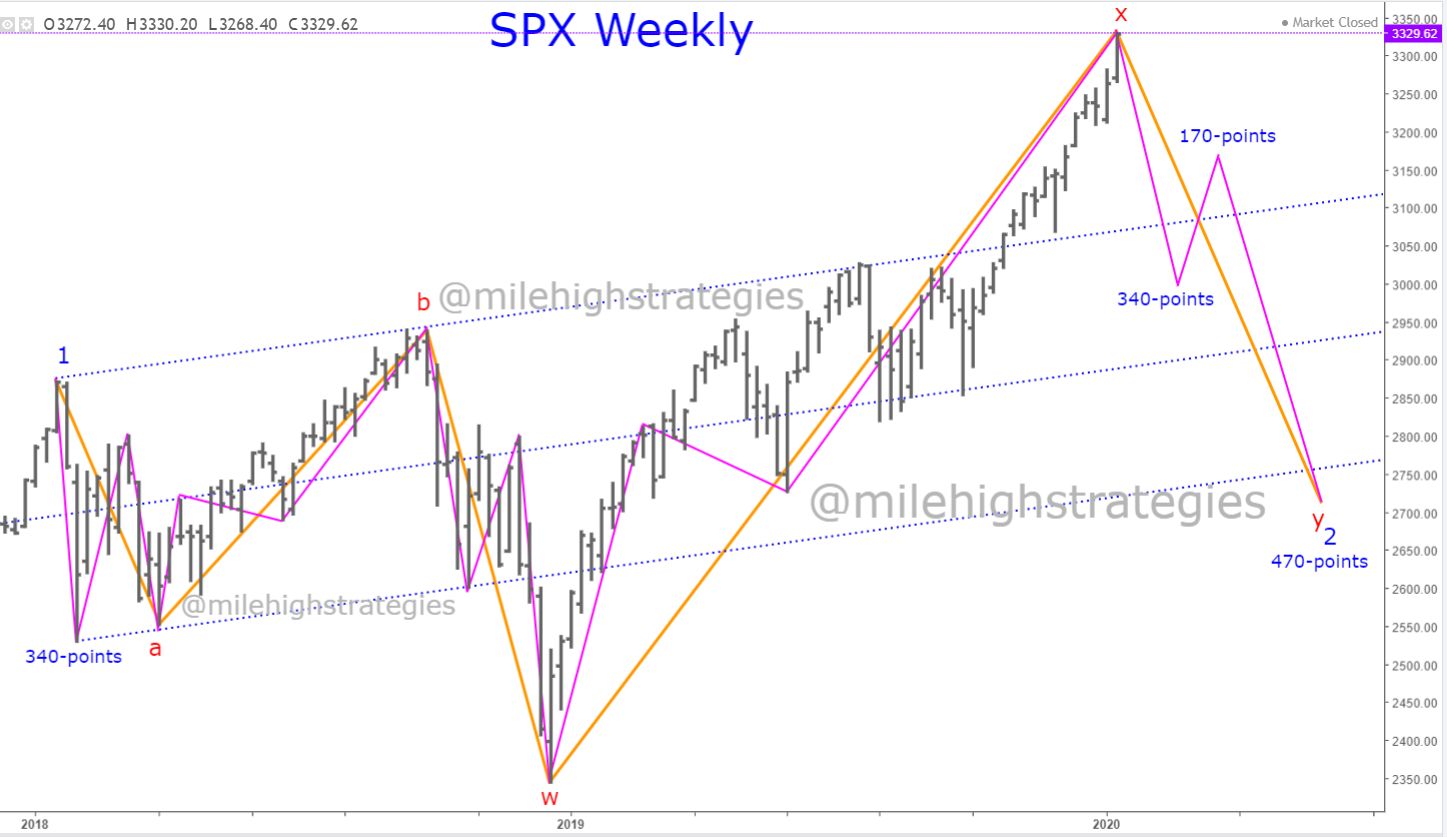
SP00s 300-min CHART UPDATE...
The momentum indicator line on the 300-min SP00s chart appears ready to drop through its UTL, which will confirm the end of wave-y:2...
The confluence of the two UTLs on the price chart on or about January 30 just below ~3100 is an interesting first target below... watching.


