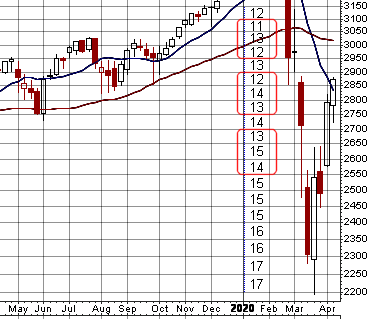
This is a snippet from a log scale stockcharts as displayed in their size 900 (900 x 673 pixels), the highest resolution they provide for free. Ideally, the scaling boxes should get progressively larger from top to bottom. The numbers shown are the vertical pixel counts within the scaling boxes. It surprises me to see 2 steps forward followed by 1 step back, as displayed in the red boxes. I would expect to see the pixel counts from box-to-box only get larger or stay the same as one progresses down the chart, but maybe if discrete scaling is being used without interpolation, a moiré effect could result from the mapping of the discrete scale to the discrete pixel grid. I guess you get what you pay for - either that or they are bent on keeping us amateurs dumb and broke.