I should have written more, so here's the IG post that went with the alternate count chart:
I mentioned in my last update that there is a possible fractal interpretation that could satisfy the possibility of the SP00s continuing upward to that still unfulfilled Hurst 40-week projection in the ~4008 range...
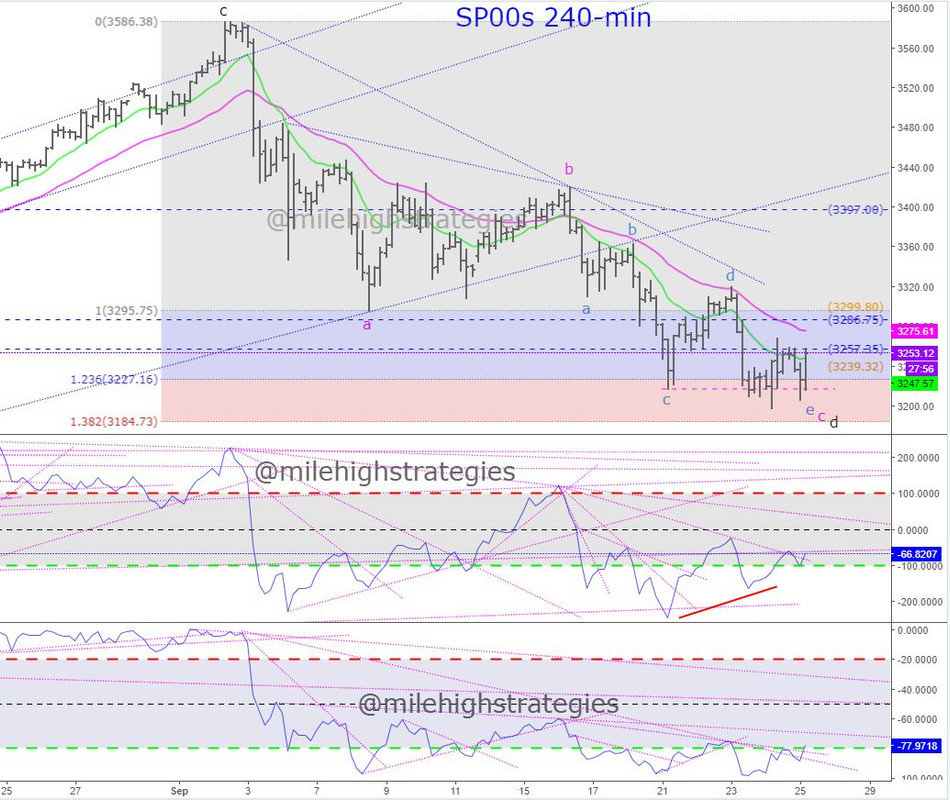
The momentum indicator line fully reset on the 240-min SP00s chart, so either an ST bottom has come, OR there's still a bit lower to go, and will build more positive divergence, OR wave-b:Y:2 is complete and the SP00s will continue downward, even with momentum that should call for a bounce (negative divergence of price versus momentum)...
Due to the controlled decline in this corrective fractal structure, I think the last scenario above is least likely, unless an exogenous event arrives, so upward now, or upward after one more pullback into the 10.2.20 timeframe are what I think will happen... watching.