https://sentimentrad...th--24-11-2020/

I'll take whats behind door #3,
Started by
slupert
, Nov 25 2020 11:20 AM
which scenario will you take?
13 replies to this topic
#2

tsharp
-

- Traders-Talk User
- 1,487 posts
Member
Posted 26 November 2020 - 03:11 PM
Only problem is, the new bull market cycle began 11-years ago, and 3000-points lower... better late than never, I reckon!

#3
tsharp
-
- Traders-Talk User
- 1,487 posts
Member
Posted 29 November 2020 - 03:14 PM
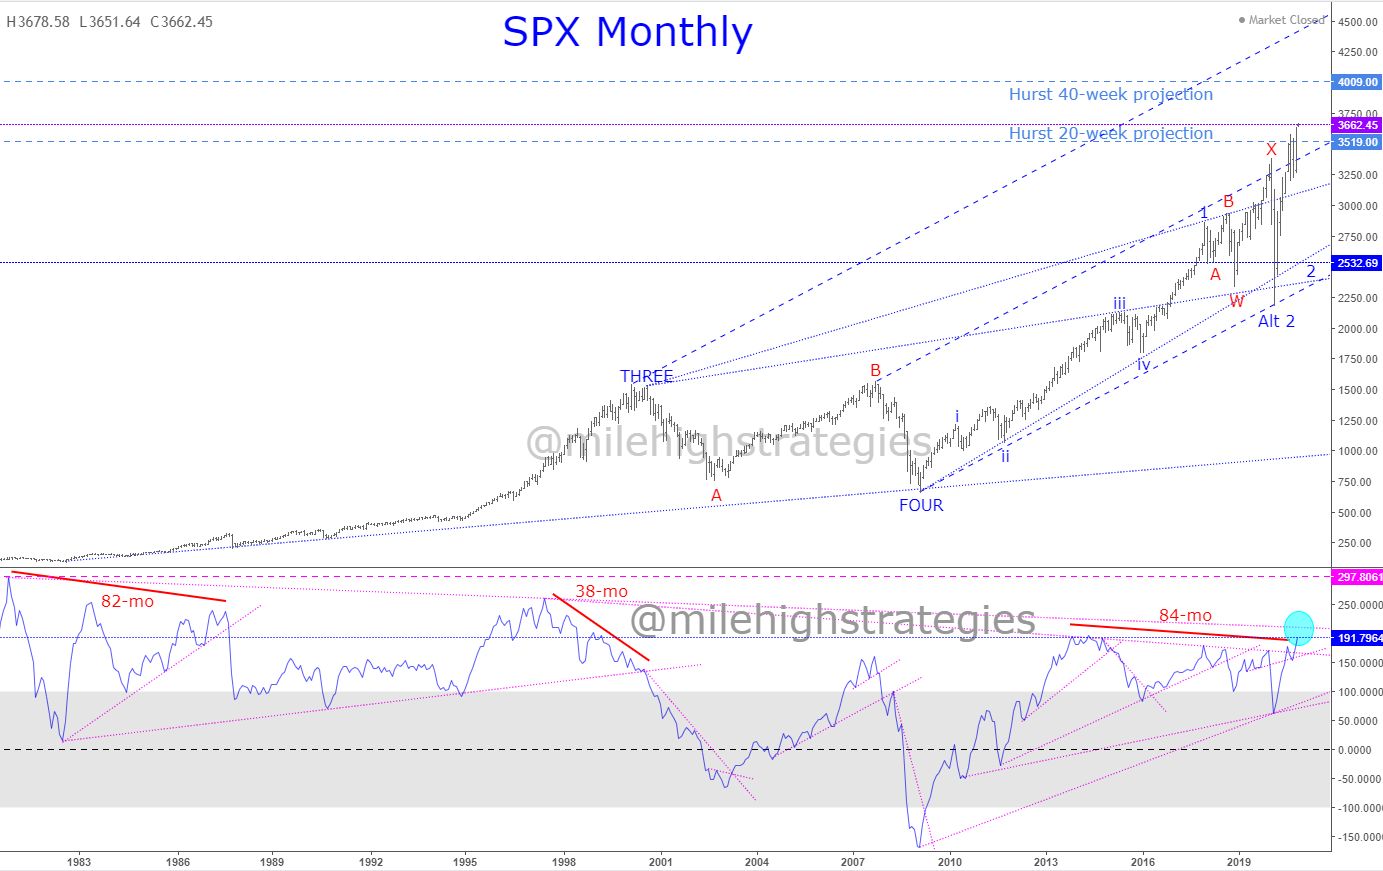
SPX MONTHLY CHART UPDATE
This is the SPX monthly chart with my momentum indicator setup at the fast setting, and with tomorrow being the last trading day of November, and the price at the top of the month's trading range, the momentum indicator line should push upward on Tuesday's new bar.
The next question will become, whether the SPX will continue upward throughout the month of December, and then the momentum indicator line exceeds the previous wave-iii:1 high, thus confirming the new highs.
A push upward to that #Hurst 40-week projection target of ~4008 would likely do that, though there are also other targets even higher... watching.

#4
tsharp
-
- Traders-Talk User
- 1,487 posts
Member
Posted 30 November 2020 - 03:45 PM
VIX WEEKLY CHART UPDATE
I haven't posted this chart for a couple months, but with the #VIX recently dropping back below 20, it may be relevant again.
I suggested back in late August that I would like to see the gap down at 17.08 filled, to give me a clue that an IT top is developing.
The VIX hasn't gotten quite that low yet, though if the SPX elects to continue upward, I think we'll see that gap fill sooner than later... watching.

#5
tsharp
-
- Traders-Talk User
- 1,487 posts
Member
Posted 30 November 2020 - 04:35 PM
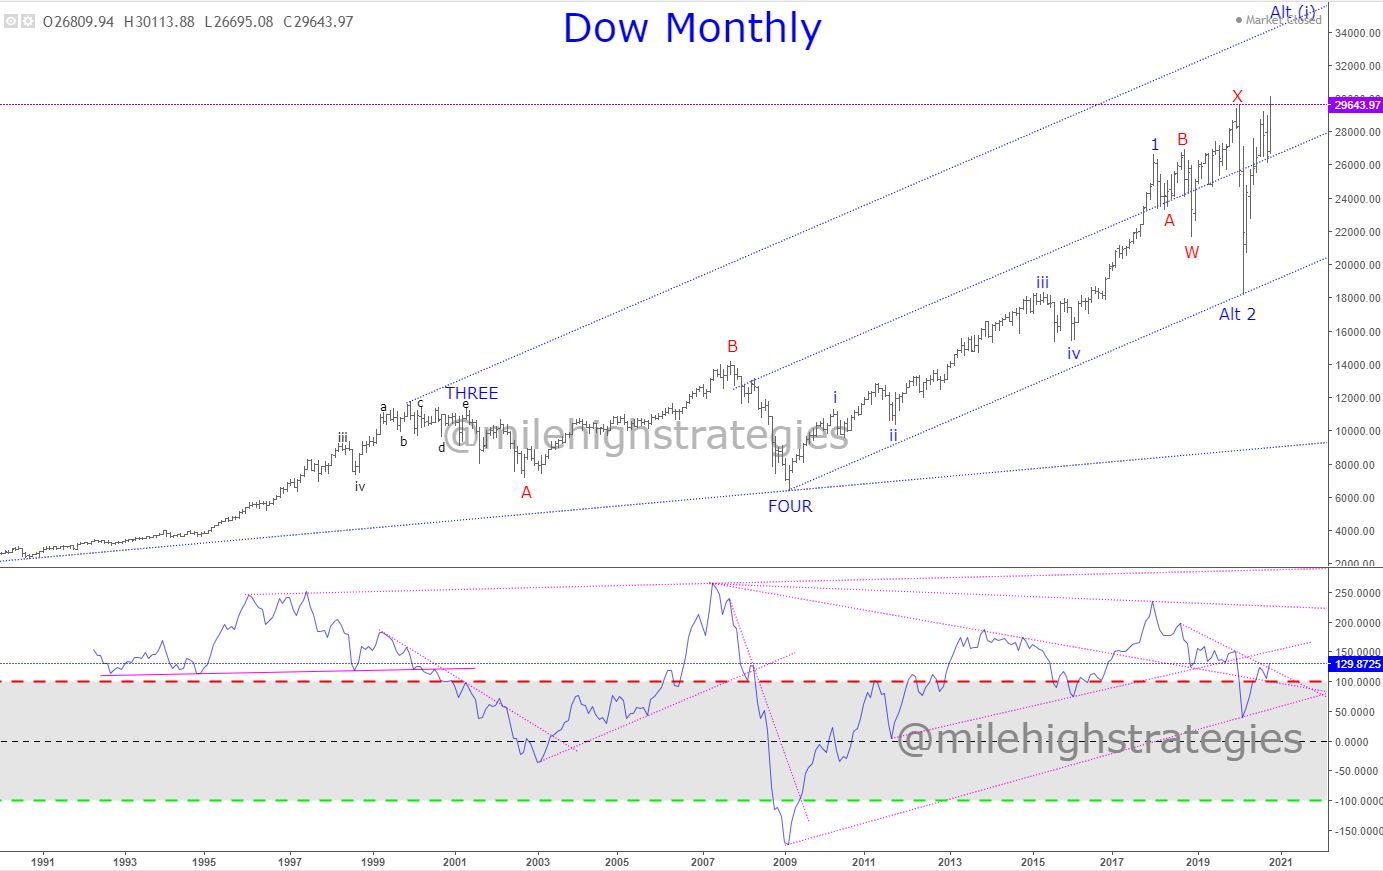
Possible IT target for the Dow?
#6
sixpack
-

- Traders-Talk User
- 62 posts
Member
Posted 30 November 2020 - 11:48 PM
I'm very skeptical of too much upside here. Lots of possibilities setting up, with no clear direction for a low risk trade. I sold the last stock in my trading account today, based on a ceiling high in a downtrend, suggesting lower prices are on the way. Could be a quick down, after which I would look to reload. Watching for now. It's been a profitable eight months. Not a single loss. I think I'll stick with the strategy of patiently waiting for the right setups. The "need" to trade for fear of missing something has never paid off well for me.
#7
tsharp
-
- Traders-Talk User
- 1,487 posts
Member
Posted 01 December 2020 - 01:59 PM
No top just yet...

#8
tsharp
-
- Traders-Talk User
- 1,487 posts
Member
Posted 01 December 2020 - 07:13 PM
SPX MONTHLY CHART UPDATE
With today being the start of a new month, I thought I'd take a look at the momentum indicator line on the SPX monthly chart, and as I thought, it has pushed upward to new relative highs, versus the Wave-1 high in January 2018, so if this holds through the month of December, these new highs will be validated, because both price and momentum are making new highs together.
If you look down at the momentum indicator chart, you'll also see I highlighted the momentum indicator line and its DTL from the first thrust in 1981, out of the WAVE-FOUR bear market cycle low - that DTL is what the momentum indicator line will attempt to push to... watching.
#9
sixpack
-
- Traders-Talk User
- 62 posts
Member
Posted 01 December 2020 - 10:37 PM
As usual, your analysis is quite good. In fact, you have been spot on for this recent push higher. Hard to argue with a breakout following a four month consolidation. Still in watch mode for now.
Edited by sixpack, 01 December 2020 - 10:41 PM.
#10
tsharp
-
- Traders-Talk User
- 1,487 posts
Member
Posted 02 December 2020 - 05:22 PM
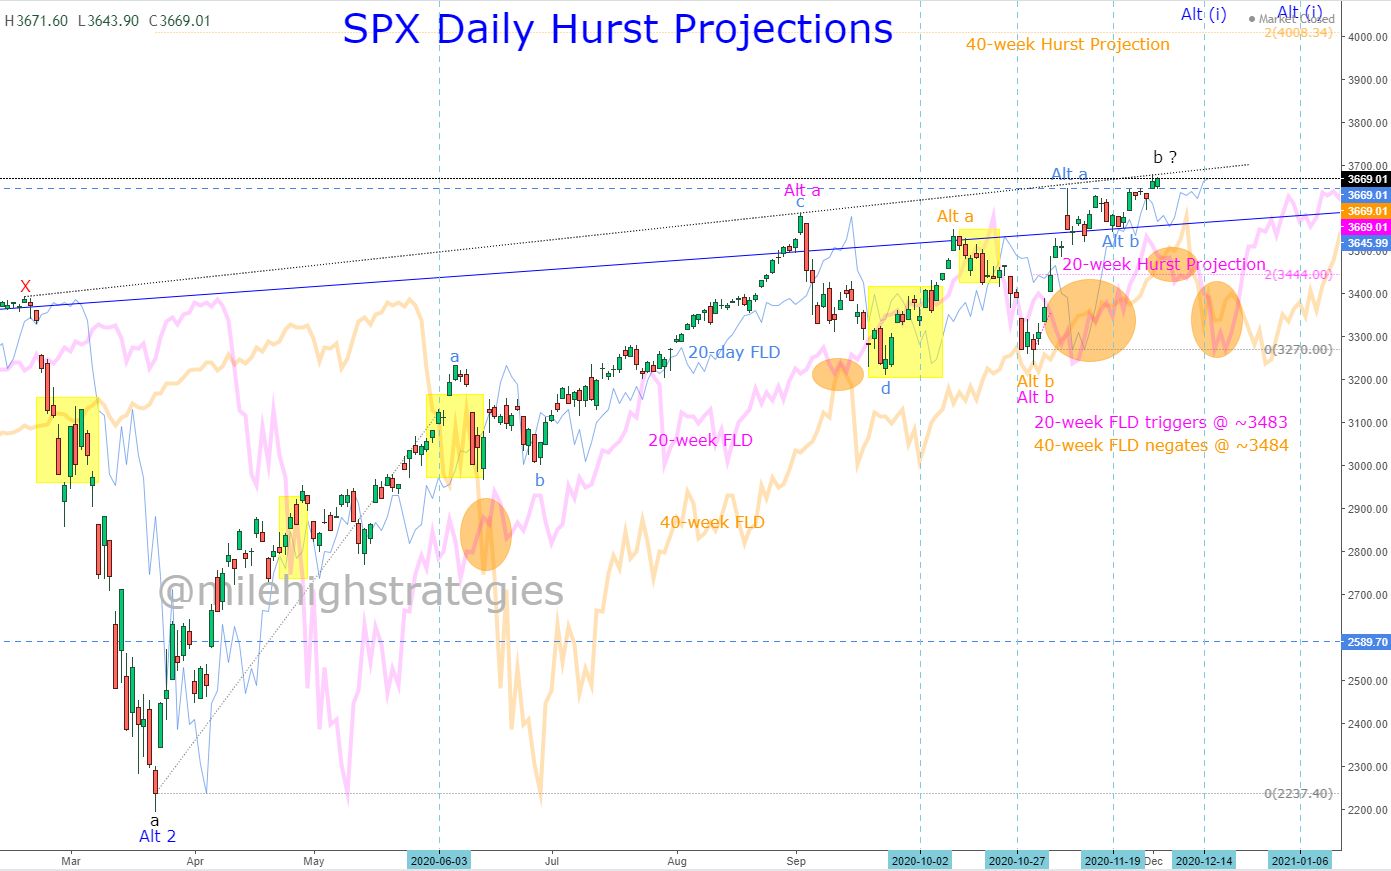
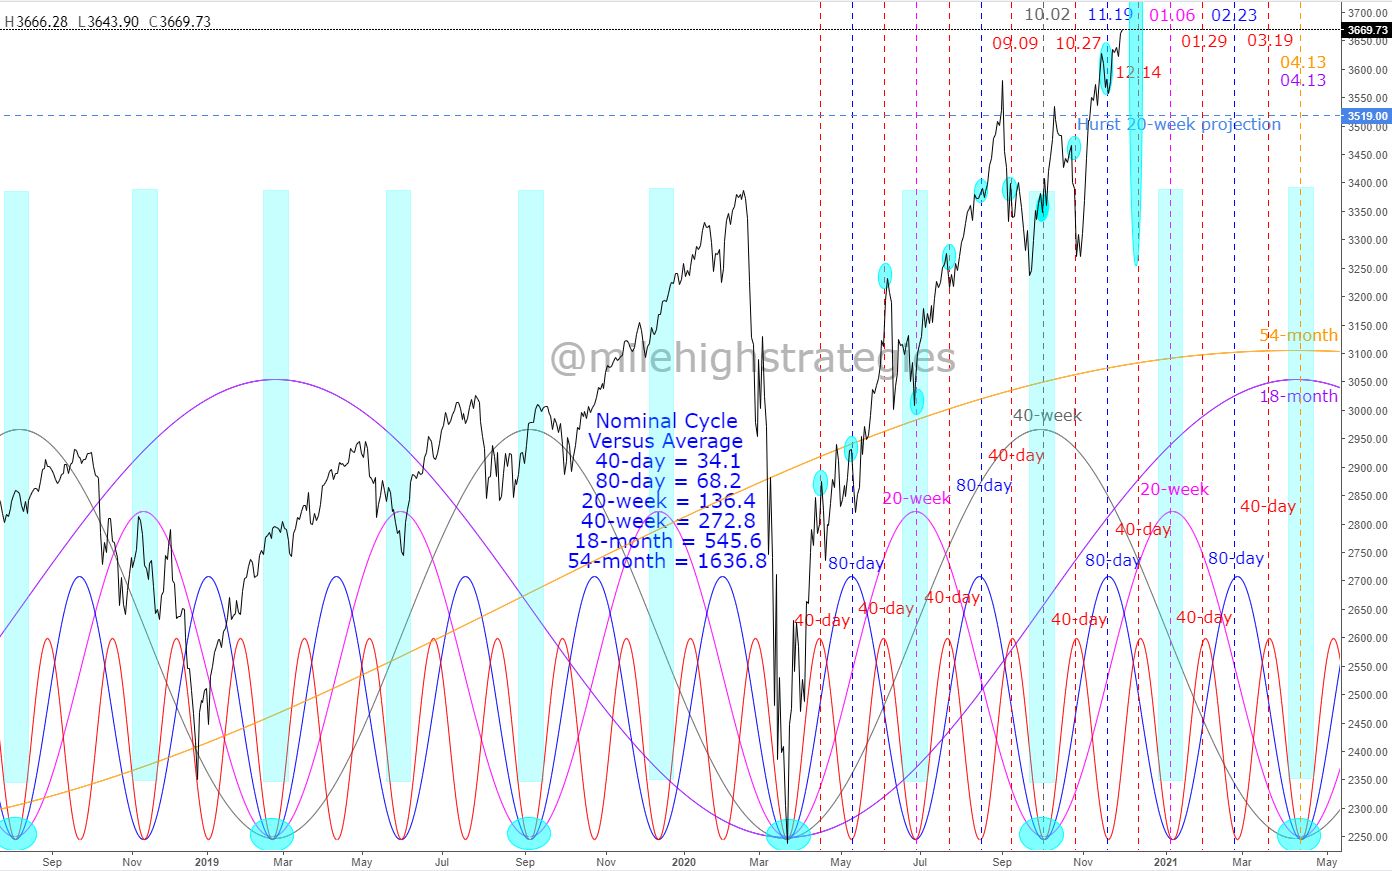
SPX DAILY HURST PROJECTIONS & CYCLES UPDATE
I updated the #Hurst nominal 20-day & 40-day FLDs chart yesterday, so am updating the nominal 20-week & 40-week FLDs chart today, though it does show the nominal 20-day FLD, which is the cadet-blue line...
While the trend remains upward, the jury remains out on which of the fractal interpretations is the actual interpretation - if the dark blue alternate interpretation is correct, then the SPX will attempt to push upward to that nominal 40-week projection, given back on 6.3.20, and is up at the ~4008 range...
If not, then the SPX could roll over anytime now in a complete wave-b:Y:2, though as you look to the second chart, the Hurst nominal cycles continue to point higher into early January, AND seasonality is upward too, so pullbacks would seem smaller at this time... watching.