SPX MONTHLY HURST CYCLES UPDATE...
There are many pioneers in the the technical analysis world, Dow, Magee, McClellan and Bollinger are a few who quickly come to mind...
And in the world of cycle analysis, Armstrong, Hurst, Elliott and Kondratiev are another few who first come to mind...
These were all gifted and brilliant men who were able to think outside the box and pioneer new ways of looking at how the financial markets function...
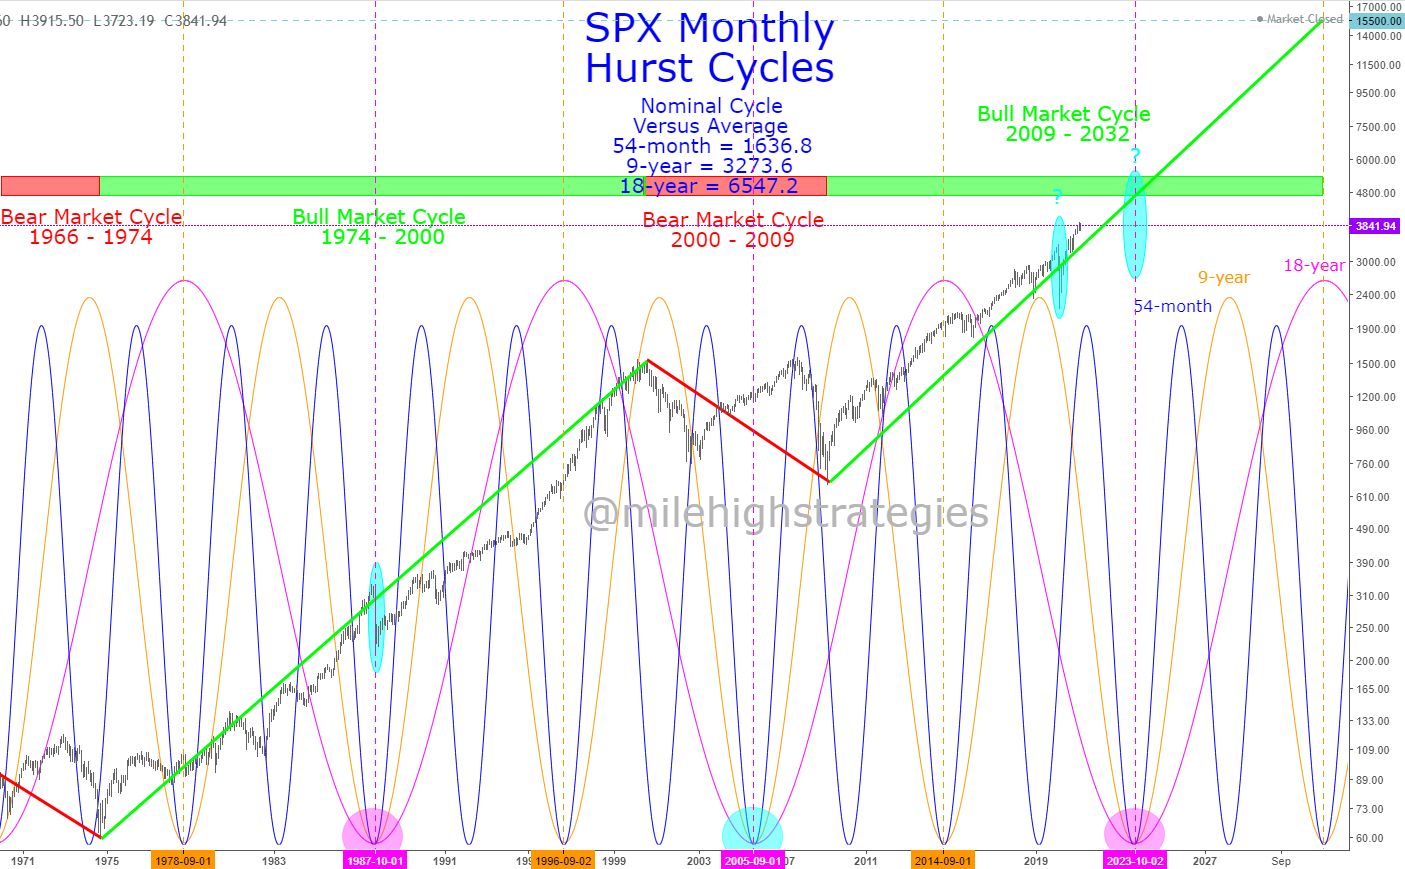
I realize I'm not in their league, though I have discovered and pioneered a new cycle which I call the Bull Market/Bear Market Cycle, that is determined by the momentum trend of the monthly SPX...
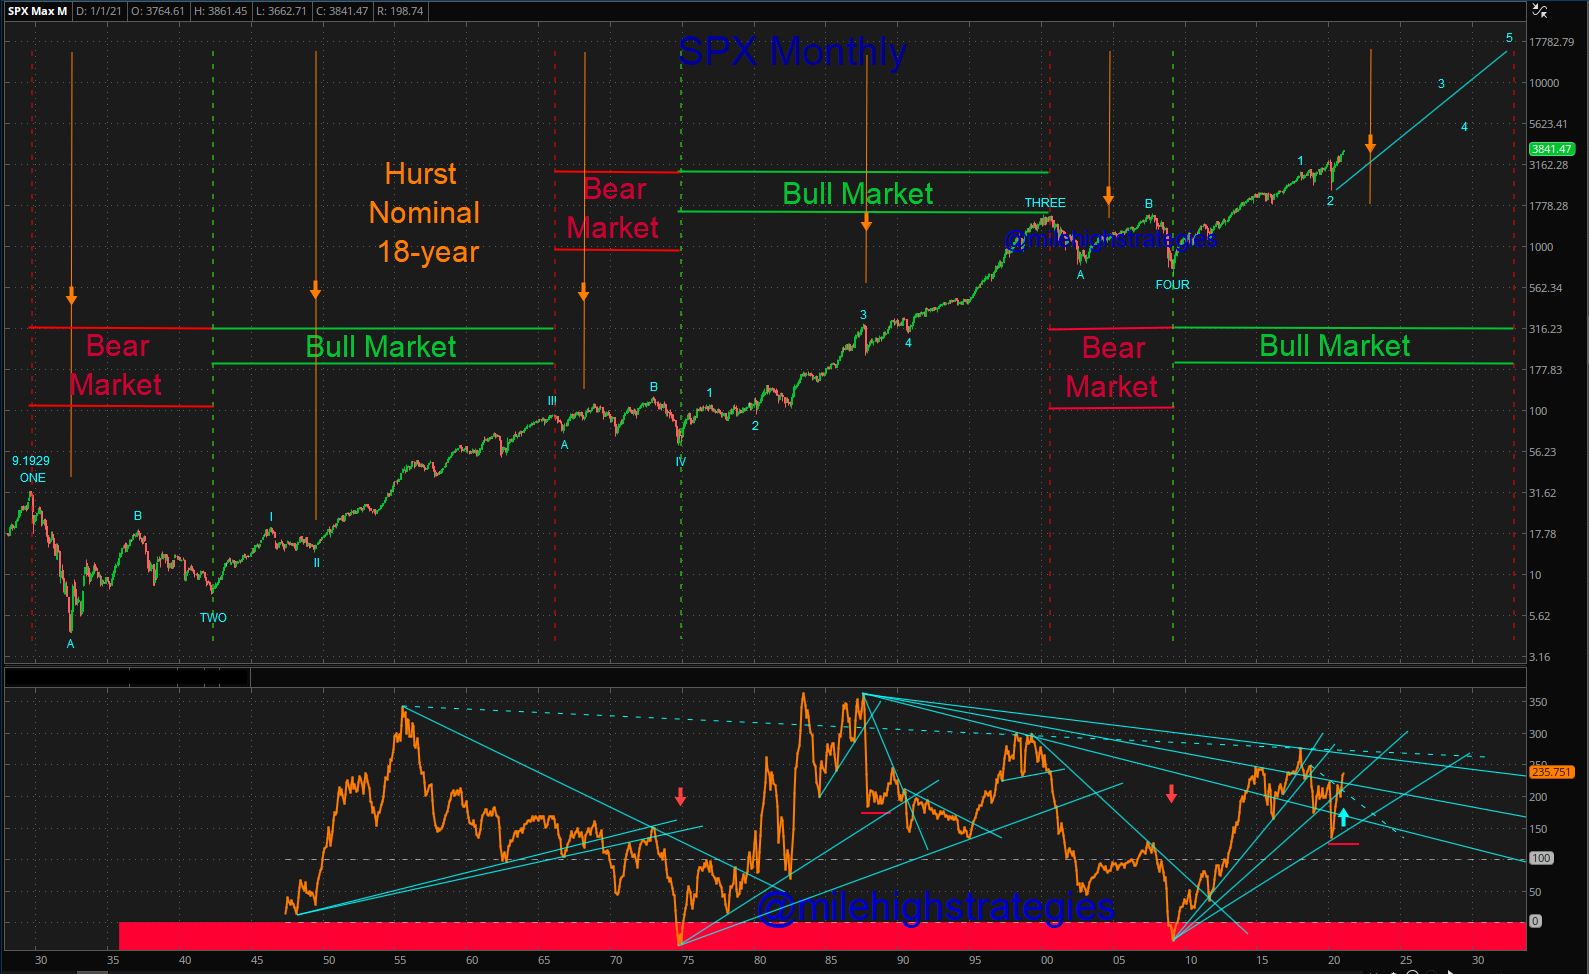
On average, a Bear Market Cycle lasts for about 8-13 years and a Bull Market Cycle lasts about 22-26 years, with the latest Bull Market Cycle starting in 2009...
What complicates matters a bit is the myriad of other cycles that need to be considered simultaneously, such as the #Hurst nominal 54-month, 9-year and 18-year cycles, and even how the confluence of these cycle troughs seem to behave differently in a bull market cycle versus a bear market cycle...
For now, I'm looking for the US equities markets to continue the upward trend of the Bull Market Cycle into ~2032, and will be watching in late 2023 to see if that confluence of cycles will create a sudden crash wave, or if it came early in 2020, due to an exogenous shock from the Coov fallout... watching.