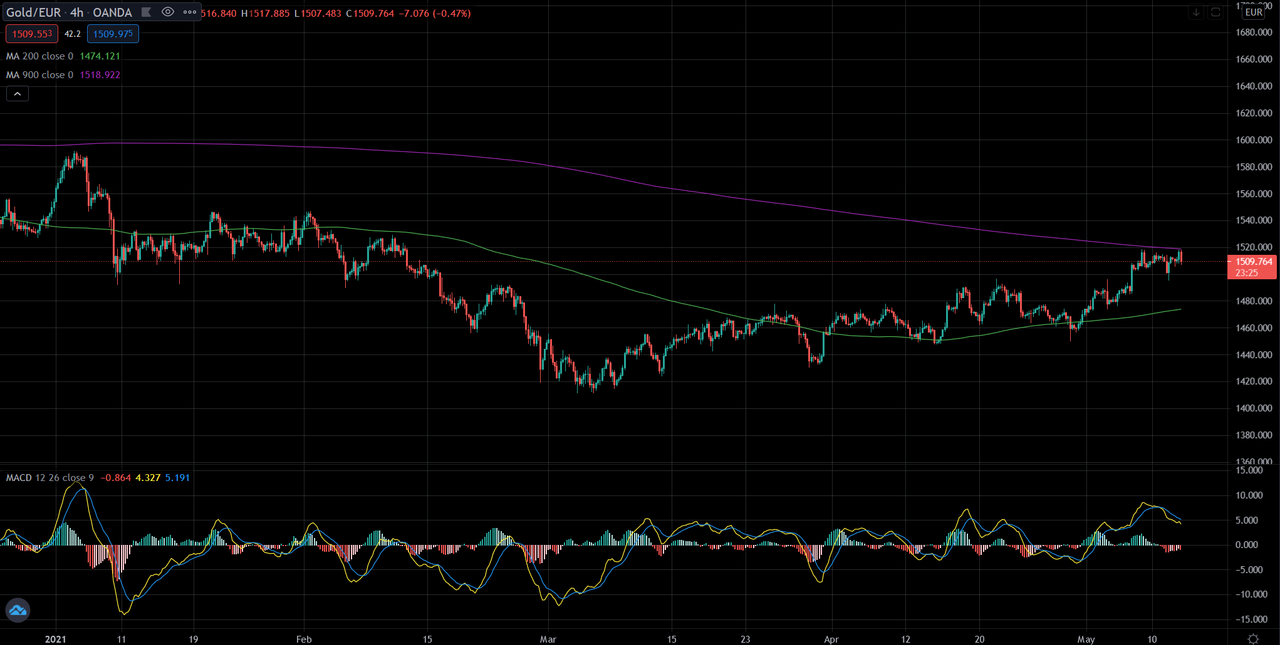
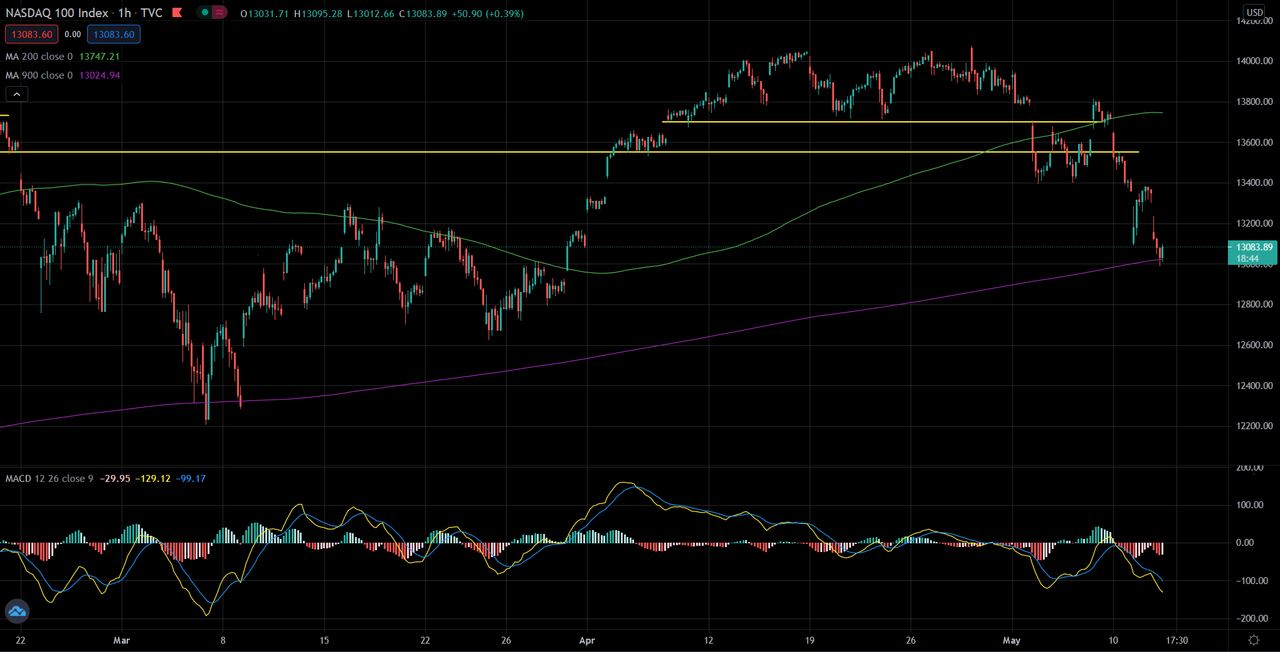
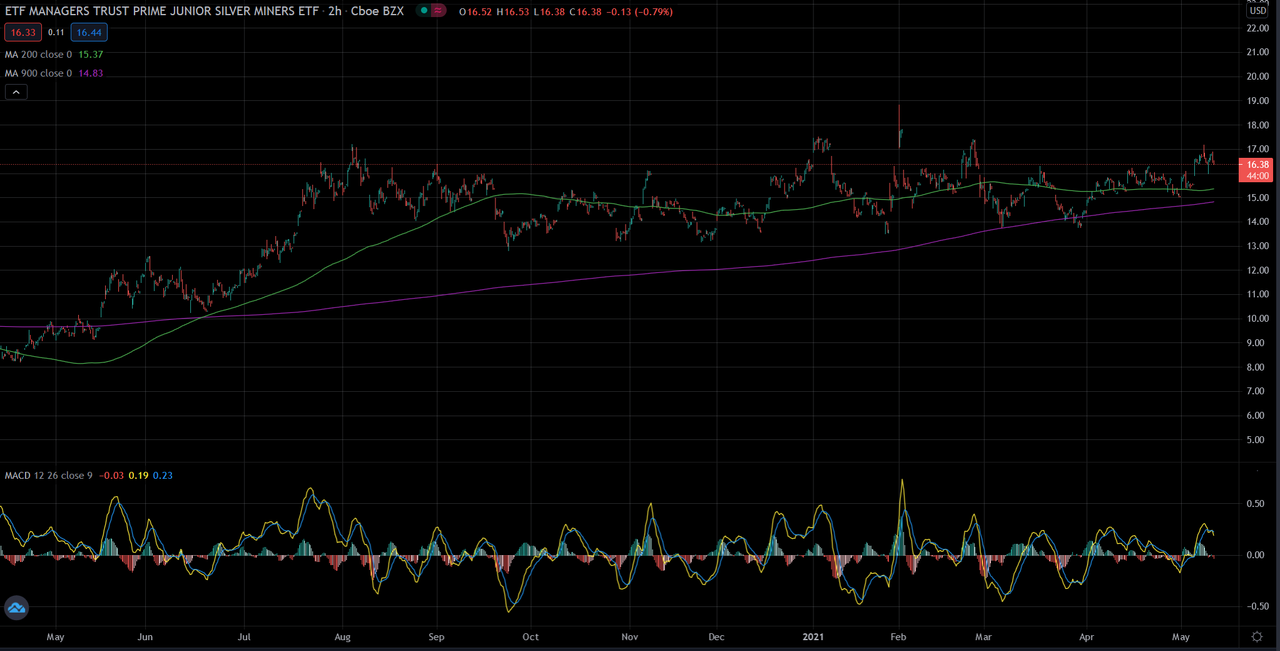
Looks to me like TNX (10 yr yield) could have a leg up here to the 2% yield area, that could cause some "issues", then after that we could see a large retrace back down to 1.5% area. just spit balling here. My problem when I look at something like SILJ is I see a HUGE 5 up from last March near 5 to 18.84 area in Feb. However it just looks to me like we have a Wave A down from that high, B up maybe done, and we "might" need a wave C down below 13. This sideways crap we've seen all year so far looks more like a sloppy B wave, NOT a wave 3 up which we should be in IF wave 2 was done. I really don't have confidence a sharp Wave C will occur to 13 in SILJ - but given the gen mkt and interest rates and charts patterns it has to be at least considered IMO. My only position remains being short a small S&P and Dow position - 95% cash. as always DYODD
Senor
SILJ still looks like a massive, 9 month long, bull flag to me, unless it fully reverses the last little pop action...bulls still get benefit of doubt for possible explosive move to the upside as long as price is above 15.
IF stocks go into full meltdown mode, then 15 probably will not hold...but thus far the relative strength is awesome....
And note the 200 MA just starting to kink upwards above the 900...that is "usually" a nascent bullish signal....
The strength of Government lies in the people's ignorance, and the Government knows this, and will therefore always oppose true enlightenment. - Leo Tolstoy