Jump to content


Photo

After the FED FIASCO ends: bounce, resume plunge


  • Please log in to reply
353 replies to this topic

#1 dTraderB

dTraderB

    Member

  • Traders-Talk User
  • 17,659 posts

Posted 06 March 2022 - 05:24 PM

The FED fiasco played a major role in current crash - ongoing - but they will get a bit of reprieve when they raise rates by a pitifully inadequate 25bps. After that bounce it us back down again. 

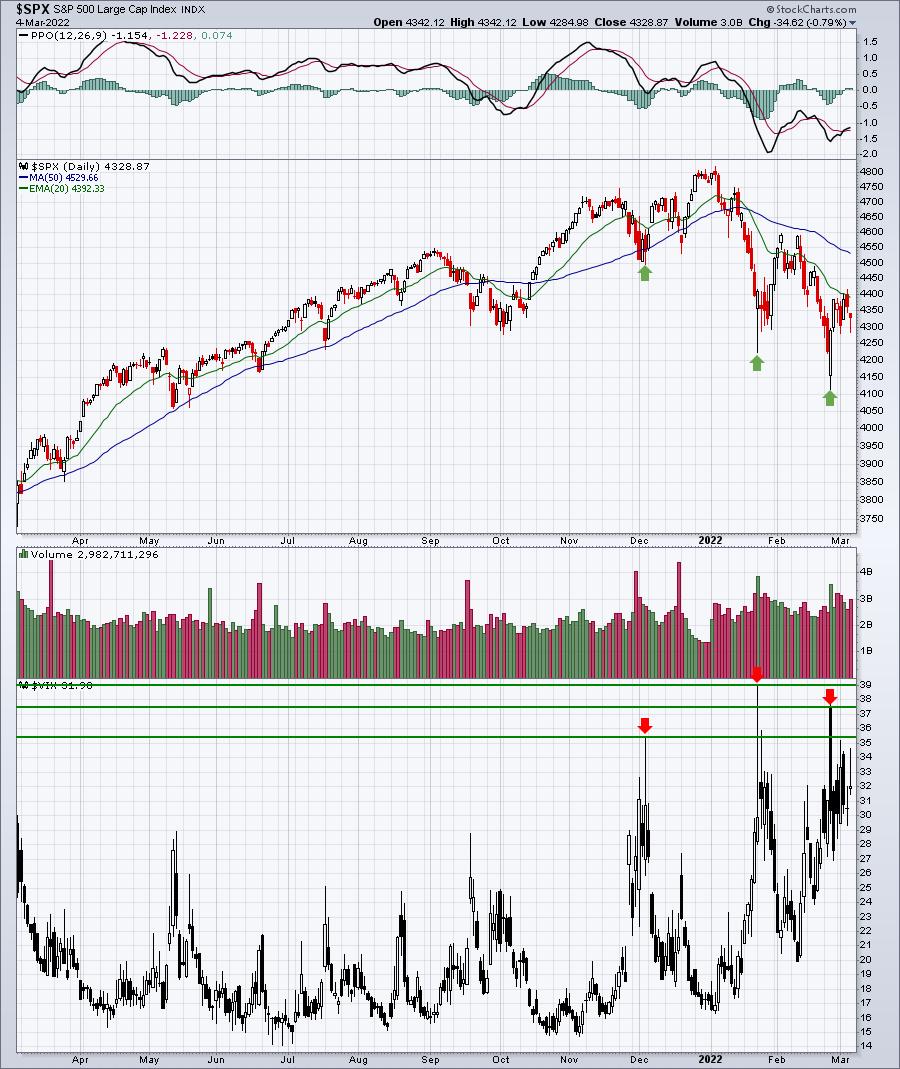
The current plunge should continue until at least the previous 2022 low with a strong possibility of a "doomsday" spike down to below ES 3800. 


Here is one opinion:


".....in the meantime, I am going to give you just the basic parameters upon which you can focus for the coming weeks. Support in the market is in the 4170-4270SPX region. As long as this pullback holds that support (which I expect it will at this time), then the next target region to focus upon is the 4500-4600SPX region. Of course, I am leaving the greater detail in my analysis to the members of The Market Pinball Wizard. But, those are adequate parameters for long term investors over the coming weeks.

Even though we have been extremely accurate in our market prognostications for years, I would like to take this opportunity to remind you that we provide our perspective by ranking probabilistic market movements based upon the structure of the market price action, which tracks market sentiment. And, if we maintain a certain primary perspective as to how the market will move next, and the market breaks that pattern, it clearly tells us that we were wrong in our initial assessment.

But here is the most important part of the analysis: We also provide you with an alternative perspective at the same time we provide you with our primary expectation, and let you know when to adopt that alternative perspective before it happens. Clearly, our alternative perspective at this time is that if we break the support cited above, I believe we can drop to test the 4000-4050SPX region before the next major rally phase begins. But, I do not see this as the greater likelihood at this time...."


#2 dTraderB

dTraderB

    Member

  • Traders-Talk User
  • 17,659 posts

Posted 06 March 2022 - 05:31 PM

Could not resist ARKK CALLS, just 8 of them as it dipped below my initial buy level. 

in LT: LONG 300 QQQ, will add more below Friday's low, 700 INDA, 500 TWTR, 300 IWM, 800 XLF. 

28 QQQ PUTS

14 SPY PUTS

1 NQ HEDGE LONG


Overall NET SHORT but barely so, want to go NET LONG on any further drop by closing PUTS and adding ETFs and stocks


,

Will add more stocks when market drops. BUT, be careful this market can reverse into a face-ripping rally all the way above ES 4600


This below is similar to my stance on the market:


Sentiment and Channel Resistance Remain Two Big Issues
Tom Bowley |  March 06, 2022 at 11:21 AM
 

Once a short-term transition from overly bullish to overly bearish begins, sentiment and channel lines can be your two best friends to help you keep your sanity. Whatever you do, turn off the media or you'll be waiting for The Great Depression 2.0. I've always found sentiment as a very solid indicator of tops and bottoms, but especially bottoms. Nothing marks a bottom like a good old-fashioned panicked selloff with capitulatory-type volume. The panic doesn't usually end until the baby goes out with the bath water and the kitchen sink.

Cyclical Bear Market Lows

Shallow pullbacks in secular bull markets can see capitulatory bottoms from time to time before rising back to all-time highs. Unfortunately, cyclical bear markets generally see more than one of these bottoms form before the ultimate bottom is established. Let's look at the 3 key lows on the S&P 500 chart below:

38c05a96-cd37-4445-8f1f-348584736ddd.jpg

All 3 lows were accompanied by VIX readings in the mid- to upper-30s. If you think this is coincidence, think again. Here's a longer-term chart that shows many bottoms printing once the VIX moves into the 30s and 40s:

continued here:


https://stockcharts....sistan-694.html


#3 dTraderB

dTraderB

    Member

  • Traders-Talk User
  • 17,659 posts

Posted 06 March 2022 - 05:32 PM

Have a great weekend! Since July 2021, only 1 zone has mattered in #ES_F: 4260-4280, and were on the 4th test.
Very simply, bull case only alive if it holds
Plan next week: Bulls need above 4350 fast which triggers to 4450, dip, 4580+.
4260 fails, we begin the sell to 4200, 4130


#4 dTraderB

dTraderB

    Member

  • Traders-Talk User
  • 17,659 posts

Posted 06 March 2022 - 05:36 PM

When too many are leaning on one side,,,, the markets will do the opposite. Seems as if too many expect a retest of ES 4100

Market may decide to rally to ES 4400 again and then drop like a stone


hkPD7AO0_mini.jpg
 
SwingTrading.eth
 
@SwingTr74597686
· Mar 4
$SPX Bearish follow through. We didn't make that low below 4322 before the close yesterday so we finished the job with a gap down. 4200 is back in play and trip below 4k eventually if we can't hold 4280


Have a great weekend! Since July 2021, only 1 zone has mattered in #ES_F: 4260-4280, and were on the 4th test.
Very simply, bull case only alive if it holds
Plan next week: Bulls need above 4350 fast which triggers to 4450, dip, 4580+.
4260 fails, we begin the sell to 4200, 4130


hkPD7AO0_mini.jpg
 
SwingTrading.eth
 
@SwingTr74597686
· Mar 4
$SPX Bearish follow through. We didn't make that low below 4322 before the close yesterday so we finished the job with a gap down. 4200 is back in play and trip below 4k eventually if we can't hold 4280


#5 dTraderB

dTraderB

    Member

  • Traders-Talk User
  • 17,659 posts

Posted 06 March 2022 - 05:42 PM

Flattening Phase of Yield Curve Cycle
 

2-10_spread_mar2022.gif


March 04, 2022


Economists fear an inverted yield curve, because of its historical tendency to be a harbinger of a coming recession.  But when it comes to the stock market, a steepening yield curve is the more problematic condition. 

This week’s chart looks at one representation of the entire yield curve, comparing the 2-year T-Note yield to the 10-year.  The entire yield curve consists of yields of various maturities all along the spectrum, but that is hard to portray in its entirety on a two-dimensional chart. 

https://www.mcoscill...ld_curve_cycle/


#6 dTraderB

dTraderB

    Member

  • Traders-Talk User
  • 17,659 posts

Posted 06 March 2022 - 05:44 PM

Just above zero.... have BULLS saved it from further decline? 


McClellanOsc_1251.gif


https://www.mcoscill...t_breadth_data/


#7 dTraderB

dTraderB

    Member

  • Traders-Talk User
  • 17,659 posts

Posted 06 March 2022 - 05:49 PM

Hasn't seen a NFM report with such low interest in a while!  Almost forgotten after about an hour as markets focused on the Ukraine situation


A packed calendar with a war, commodities prices soaring, inflation not slowing, FED caught on their own trap, this will be a very volatile week. If no worsening of the Ukraine situation I expect the markets to finish the week UP.   Yes, UP!   But, more likely, it will be much more pessimistic and there will be further declines. But, will it finally capitulate into a panic selling with VIX above 40 and a ST bottom?


TUESDAY, MARCH 8  
00:01   GBP   BRC Like-For-Like Retail Sales (YoY)(Feb)     
10:00   EUR   Gross Domestic Product s.a. (QoQ)(Q4)     
10:00   EUR   Gross Domestic Product s.a. (YoY)(Q4)
             
13:30   USD   Goods and Services Trade Balance(Jan)     
13:30   CAD   International Merchandise Trade(Jan)     
22:15   AUD   RBA's Governor Lowe speech     
23:30   AUD   Westpac Consumer Confidence(Mar)     
23:50   JPY   Gross Domestic Product (QoQ)(Q4)     
23:50   JPY   Gross Domestic Product Annualized(Q4)  

        
WEDNESDAY, MARCH 9
01:30   CNY   Consumer Price Index (MoM)(Feb)     
01:30   CNY   Consumer Price Index (YoY)(Feb)     
01:30   CNY   Producer Price Index (YoY)(Feb)     
08:00   AUD   RBA's Debelle speech     
N/A      GBP   Budget Report     


THURSDAY, MARCH 10 
00:00   AUD   Consumer Inflation Expectations(Mar)     
12:45   EUR   ECB Deposit Rate Decision     
12:45   EUR   ECB Interest Rate Decision     
12:45   EUR   ECB Monetary Policy Decision Statement
     
13:30   USD   Consumer Price Index (MoM)(Feb)     
13:30   USD   Consumer Price Index (YoY)(Feb)     
13:30   USD   Consumer Price Index Core s.a(Feb)     
13:30   USD   Consumer Price Index ex Food & Energy (MoM)(Feb)         
13:30   USD   Consumer Price Index ex Food & Energy (YoY)(Feb)
     
13:30   USD   Initial Jobless Claims(Mar 4)     
13:30   USD   Initial Jobless Claims 4-week average(Mar 4)     
13:30   EUR   ECB Press Conference     
19:00   USD   Monthly Budget Statement(Feb)     
20:00   NZD   REINZ House Price Index (MoM)(Feb)     
21:30   NZD   Business NZ PMI(Feb)     
22:15   AUD   RBA's Governor Lowe speech     
23:30   JPY    Overall Household Spending (YoY)(Jan)         


FRIDAY, MARCH 11  
07:00   GBP   Gross Domestic Product (MoM)(Jan)     
07:00   GBP   Industrial Production (MoM)(Jan)     
07:00   GBP   Manufacturing Production (MoM)(Jan)     
07:00   GBP   Manufacturing Production (YoY)(Jan)     
07:00   GER   Harmonized Index of Consumer Prices (YoY)(Feb)     
N/A       GBP   NIESR GDP Estimate (3M)(Feb)     
13:30    CAD   Average Hourly Wages (YoY)(Feb)     
13:30    CAD  Net Change in Employment(Feb)     
13:30    CAD   Participation Rate(Feb)     
13:30    CAD   Unemployment Rate(Feb)     
15:00    USD   Michigan Consumer Sentiment Index(Mar) PREL


#8 dTraderB

dTraderB

    Member

  • Traders-Talk User
  • 17,659 posts

Posted 06 March 2022 - 05:51 PM

A/D not too bad but SUMMATION looks ugly


https://www.marketin...ce-decline-line


https://www.marketin...summation-index


#9 dTraderB

dTraderB

    Member

  • Traders-Talk User
  • 17,659 posts

Posted 06 March 2022 - 05:54 PM

PANIC BUTTON still not pushed..... 


Concerns aplenty, but investors haven't pushed the Panic Button


https://www.sentimen...e-panic-button/


#10 dTraderB

dTraderB

    Member

  • Traders-Talk User
  • 17,659 posts

Posted 06 March 2022 - 05:55 PM

"The one-two combination of skyrocketing inflation and a potential multi-country war should have been the last straw. Curiously, however, investors haven't panicked.

Sure, some readings show pessimism. But the Panic Button has not been pressed.

The Panic Button incorporates volatility, interest rates, liquidity, bond spreads, and default protection costs to highlight those periods of outright terror when markets tank. When there is a crisis that spreads across markets and geographies, these measures tend to rise in tandem.

We discussed the Panic Button after it was triggered in January 2016 and March 2020, but it has been curiously flaccid lately. It's still sitting at zero. 

20220302-214733_1646257651888.jpg

Typically, we look to fade extremes. When investors panic in both directions, markets have a high probability of going the other direction. So, when we've looked at the Panic Button in the past, it was related to a high reading.

We took a look at times when the S&P 500 fell into a correction but investors weren't panicking to see if that was a good sign...or not."

Link below

PANIC BUTTON still not pushed..... 


Concerns aplenty, but investors haven't pushed the Panic Button


https://www.sentimen...e-panic-button/