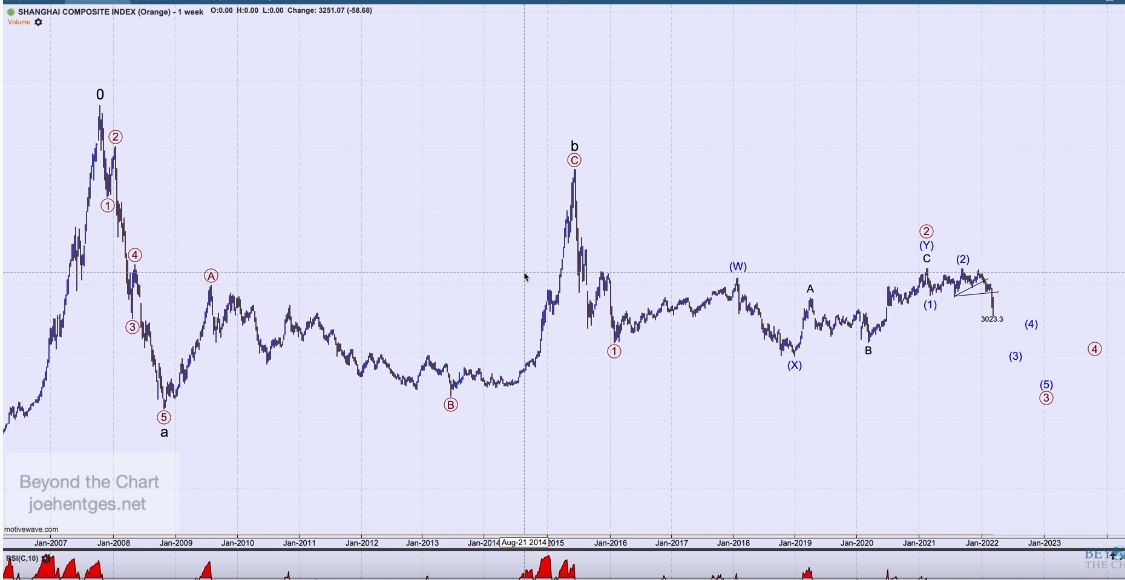
This is a log chart of SSE. I just wanted to show what, I think is going on in China.

Member
Posted 16 March 2022 - 09:52 AM
This is a log chart of SSE. I just wanted to show what, I think is going on in China.
Member

Posted 16 March 2022 - 11:41 AM
Speaking of the potential sloppiness I mentioned with your Hang Seng count post, that symmetrical triangle is a doozie! 
Fib
Better to ignore me than abhor me.
“Wise men don't need advice. Fools won't take it” - Benjamin Franklin
"Beware of false knowledge; it is more dangerous than ignorance" - George Bernard Shaw
Demagogue: A leader who makes use of popular prejudices, false claims and promises in order to gain power.
Technical Watch Subscriptions
Member
Posted 16 March 2022 - 01:47 PM
Speaking of the potential sloppiness I mentioned with your Hang Seng count post, that symmetrical triangle is a doozie!
Fib
If you want textbook Elliot Wave counts, you need to stop looking at real markets. This is not a symmetrical triangle anyway, it's an ABCDE Elliot Wave triangle. It fits the count very well with large degree ABC. If you want to see an an example of totally ridiculous ABC count, you need not look further than Pretcter.
Member

Posted 20 March 2022 - 12:08 PM
Member
Posted 20 March 2022 - 02:25 PM
This is a clearer chart of the contracting triangle from Nov '07. With legs A and B completed, I see it as C wave up?
Member
Posted 20 March 2022 - 02:32 PM
This is someone else bearish interpretation of SSE.
Edited by linrom1, 20 March 2022 - 02:33 PM.


