Jump to content


Photo

QQQ peak/trough realization


  • Please log in to reply
12 replies to this topic

#1 barbu

barbu

    Member

  • Traders-Talk User
  • 265 posts

Posted 07 August 2023 - 12:49 PM

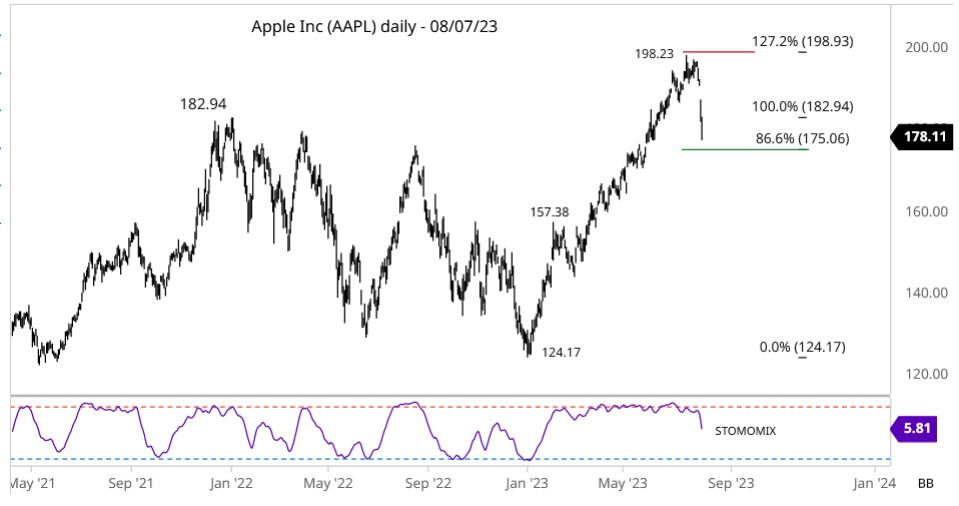
QQQ trajectory's peak and trough complies with a few very simple ratios, the 0.866 is a very critical threshold.

Bulls are hoping Fed's rate cutting in 2024, this wishful thinking prevents sizable pullback from happening in the next few months.  however, they are riding on the borrowed time for too long, a slow grinding bear market is coming.


square root(1.618)=1.272

b2b582a69154Vo34jct2.jpg


b2b582a69178DX7FUcIO.jpg


#2 barbu

barbu

    Member

  • Traders-Talk User
  • 265 posts

Posted 07 August 2023 - 01:18 PM

Apple is ripe

Isaac Newton: What goes up must come down.


 Stochastic Momentum Index STOMOIX

b56539731574rWhslVX3.jpg


#3 barbu

barbu

    Member

  • Traders-Talk User
  • 265 posts

Posted 07 August 2023 - 03:16 PM

Amazon stock price has topped out,  The chance  it makes a new all time high in the next few quarters is slim.

1.91 = 0.382 * 5, is a frequent observed ratio, 0.577 = square root(3)/3, a W.D Gann hexagonal derived ratio

062c685e8996cmSywyyx.jpg


#4 barbu

barbu

    Member

  • Traders-Talk User
  • 265 posts

Posted 07 August 2023 - 04:37 PM

US Ramps Up Debt Issuance, Adding Fuel to Selloff in Treasuries 08/02/23  [  the detail schedule -  Do you own due diligence ]


Yellen sells ( much more .....) treasuires,  thus why the long rate is moving up.....

After roughly 8 to 9 months consolidations, TLT falls below its important support  97.66, It is heading to a new low.

73e6f63b4757CFS6PCw2.jpg


Edited by barbu, 07 August 2023 - 04:47 PM.


#5 barbu

barbu

    Member

  • Traders-Talk User
  • 265 posts

Posted 07 August 2023 - 10:37 PM

Tesla made its all time high in 4Q/2021, in spite of last few months' impressive run-up, it is still in the down trend, it will face increasingly tough competition.


7ad0635853954AxtxJlW.jpg


#6 SteveB

SteveB

    Member

  • Traders-Talk User
  • 90 posts

Posted 07 August 2023 - 10:52 PM

The board is quiet now (before the storm?). Not much to see here on TT recently other than the usual snorts. Thank you for contributing your charts! Nice to see another perspective with trend lines and support lines in bonds. Lets see if they hold. Please keep posting.

#7 MDurkin

MDurkin

    Member

  • Traders-Talk User
  • 638 posts

Posted 08 August 2023 - 02:17 AM

US Ramps Up Debt Issuance, Adding Fuel to Selloff in Treasuries 08/02/23  [  the detail schedule -  Do you own due diligence ]


Yellen sells ( much more .....) treasuires,  thus why the long rate is moving up.....

After roughly 8 to 9 months consolidations, TLT falls below its important support  97.66, It is heading to a new low.

73e6f63b4757CFS6PCw2.jpg


Nice chart. Do you have a target for TLT?


#8 barbu

barbu

    Member

  • Traders-Talk User
  • 265 posts

Posted 08 August 2023 - 09:13 AM


US Ramps Up Debt Issuance, Adding Fuel to Selloff in Treasuries 08/02/23  [  the detail schedule -  Do you own due diligence ]


Yellen sells ( much more .....) treasuires,  thus why the long rate is moving up.....

After roughly 8 to 9 months consolidations, TLT falls below its important support  97.66, It is heading to a new low.


Nice chart. Do you have a target for TLT?


MDurkin


imho, the TLT low target zone is 87-81(86.68-81.05), when price approaches the target zone, a fine tuning task is required , Timing wise is not clear yet, anyway, TLT moves in a relative slow fashion, intermixes with up/down swings, so there is no hurry to nail the time window at this moment.


2.121 = 0.707 * 3

021480503005l4acCNaA.jpg


#9 barbu

barbu

    Member

  • Traders-Talk User
  • 265 posts

Posted 08 August 2023 - 10:15 AM

S&P500 ($SPX) short term 1st target zone  4448-4430-4403 (refer to the following chart)


timing - middle August - end of August +/-,  [2022 summer peak on 08/16/22 @4325.28, WD Gann 360 degree, anniversary]


0.866 = cos(30 degree), 1,571 half of PI, 2.121 = 0.707 * 3


2cdb7bbc7443t51wqn5n.jpg


#10 MDurkin

MDurkin

    Member

  • Traders-Talk User
  • 638 posts

Posted 08 August 2023 - 10:33 AM


US Ramps Up Debt Issuance, Adding Fuel to Selloff in Treasuries 08/02/23  [  the detail schedule -  Do you own due diligence ]


Yellen sells ( much more .....) treasuires,  thus why the long rate is moving up.....

After roughly 8 to 9 months consolidations, TLT falls below its important support  97.66, It is heading to a new low.


Nice chart. Do you have a target for TLT?


MDurkin


imho, the TLT low target zone is 87-81(86.68-81.05), when price approaches the target zone, a fine tuning task is required , Timing wise is not clear yet, anyway, TLT moves in a relative slow fashion, intermixes with up/down swings, so there is no hurry to nail the time window at this moment.


2.121 = 0.707 * 3

021480503005l4acCNaA.jpg


Thanks.