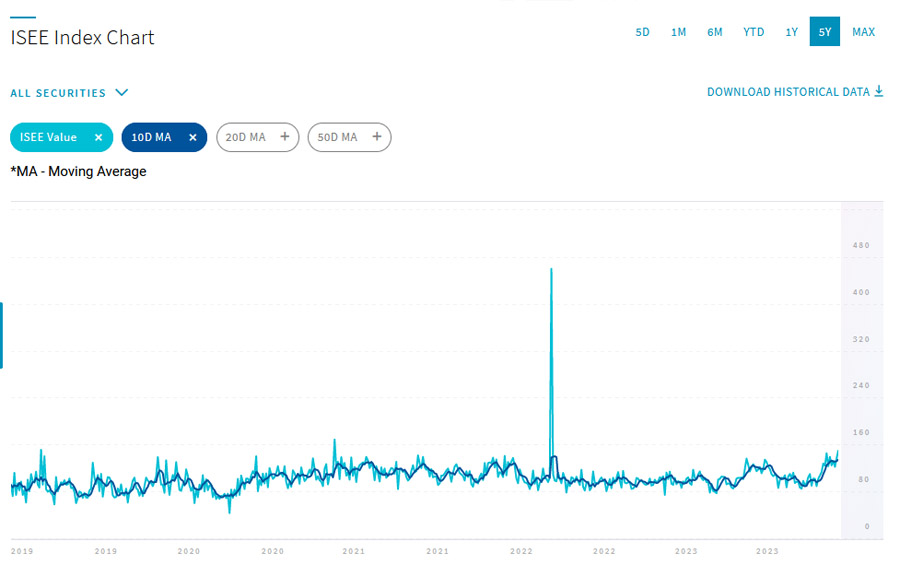
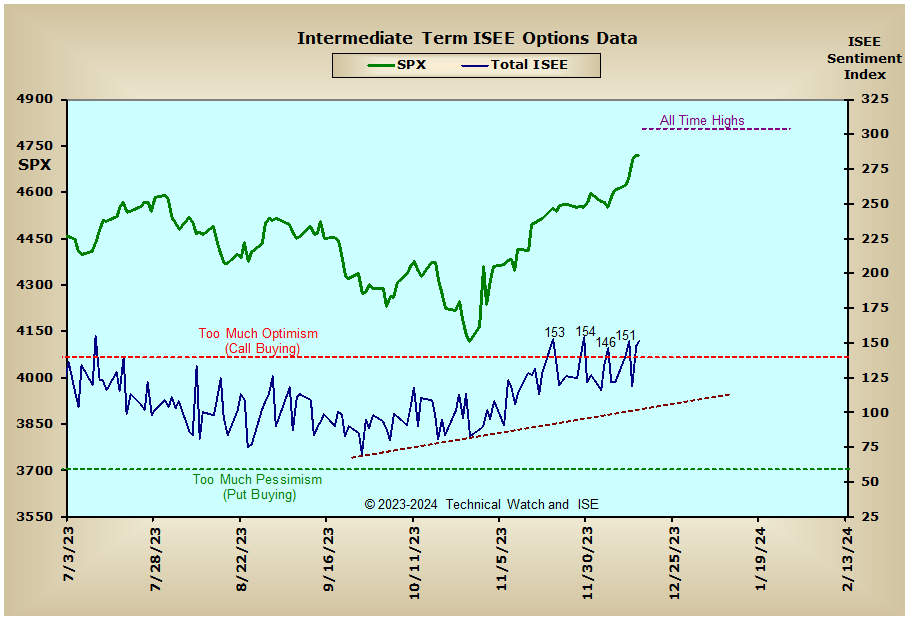
The ISEE 10-day is probably the most reliable top-spotter we have, and it's flashing a rare Sell.
The daily chart of the ISEE Index is provided below for further discussion. You can see why the moving averages are as high as they are at a glance with 140 on the call side and 60 on the put side deemed as emotional extremes.With today's 155 reading, these are the simple moving averages I work with:
5 day ma is at 145
8 day ma is at 140
10 day ma is at 139
20 day ma is at 135
Quit the cluster.
Oh...and the last time the 10 day ma was above the 130 level was December 29, 2021...3 days before the SPX topped out before 2022's bear market condition.
Fib
https://tinyurl.com/ystrvcld
Better to ignore me than abhor me.
“Wise men don't need advice. Fools won't take it” - Benjamin Franklin
"Beware of false knowledge; it is more dangerous than ignorance" - George Bernard Shaw
Demagogue: A leader who makes use of popular prejudices, false claims and promises in order to gain power.
Technical Watch Subscriptions