Jump to content


Photo

XAU/HUI Flagging Behind Gold?


  • Please log in to reply
2 replies to this topic

#1 SilentOne

SilentOne

    Member

  • Traders-Talk User
  • 3,452 posts

Posted 09 November 2004 - 06:37 PM

Lots of folks are looking at the gold sector and can't figure out why the gold indices are not rising faster than the price of gold. This move up is not typical of the rise in gold shares witnessed in the previous three legs up. And they are right, there is no denying it. So why is this??

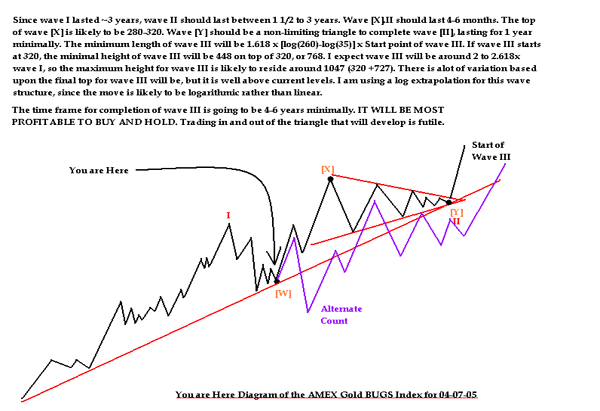
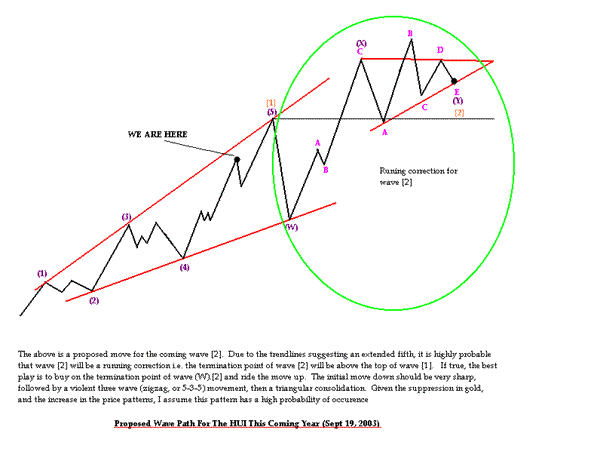
David Petch proposed sometime ago that the wave II correction off the Dec. '03 top would be a running correction. So far he may be right. What does that mean? Well to put it in simple terms, instead of a wave II correction down (after the first wave I up), wave II will correct sideways with an upward bias, basically marking time until the next major leg starts (wave III).
Posted Image

The thing that gets me is that he called for this running correction over a year ago. And I am almost certain that he is right and that we are in his wave II "X" leg up.
Posted Image

I am sure you don't have to look at this figure long to make out where we are today. See that little AB consolidation between the W and X labels? We Have been doing that in the last several weeks. Now get ready for another move higher.

You can read up on his recent articles here. I think it makes sense in many ways and is being confirmed by recent action. I know one thing this bull it will do, frustrate the heck out most folks and keep them away from this sector.

http://www.gold-eagl...etch070704.html

http://www.gold-eagl...etch092403.html

http://www.gold-eagl...etch103004.html

And you know what I always say? It takes a really good waver to know one. I subscribe to him and he is worth every penny. :D

So there you have. That confounded divergence between the miners and the metal. And I bet it keeps some of you short or completely out of the miners.

cheers,

john
"By the Law of Periodical Repetition, everything which has happened once must happen again and again and again-and not capriciously, but at regular periods, and each thing in its own period, not another's, and each obeying its own law ..." - Mark Twain

#2 SilentOne

SilentOne

    Member

  • Traders-Talk User
  • 3,452 posts

Posted 13 November 2004 - 11:34 AM

No comments on the above post? Plenty of readers though. I can see that it has generated some discussion on other boards.

Well I'll add some more meat to Petch's case above. And BTW, for all you ewave naysayers, if you really understand the theory you'd recognize its shortcomings and account for it. What Petch does really well is combine technicals with probable ewave projections. He can be wrong. But he is certainly fairing a lot better than the lot of them.

So here is a thought on cycles for the HUI. Petch posted this chart last year.

Posted Image

He generated a +260 HUI target from this chart. What was most interesting though were the 14.5 month cycles he noted.

Take the origin of the chart below as zero for this gold bull (Nov. '00). This was when I bought my first gold stocks in earnest BTW, watching the Florida chad count saga (which was the "why").

http://bigcharts.mar...&mocktick=1.gif

Count 14.5 months forward to Jan. 02. This was the start of the second great run (was lucky enough to have played DROOY, GFI then). The ensuing run lasted 5-6 months then topped out.

Now count 14.5 months forward from Jan. '02 and you get March '03 which was the start of last year's great run. Last year's leg lasted 9 months counting the early Dec. peak as the top.

Finally, count 14.5 months forward from March '03 and you get low and behold mid-May '04. Notice too how the Williams indicator on the weekly chart marks each point. Hmmmm ....

So if this is a bull, and cycles are to become bullish, we should have a run here for at least 9 months from May if not more. By this thinking a top is not projected until sometime in Jan. '05. It may not be impulsive as Petch suggests, but strength can persist here. So I'd watch the 14.5 month cycles and expect a high early in the cycle (bullish BTW) and a low to be made thereafter. Each major leg seems to start very near 14.5 month intervals. Man I wish I was aware of this last year. :huh:

Gann charts also seem to confirm that we are in a power up mode. I'll show why in the next post.

cheers,

john

Edited by SilentOne, 13 November 2004 - 11:41 AM.

"By the Law of Periodical Repetition, everything which has happened once must happen again and again and again-and not capriciously, but at regular periods, and each thing in its own period, not another's, and each obeying its own law ..." - Mark Twain

#3 SilentOne

SilentOne

    Member

  • Traders-Talk User
  • 3,452 posts

Posted 13 November 2004 - 12:00 PM

Whenever we rise above and hold the rising Gann line on these charts, we zoomed. The one I am referring to is the rising line which seems to be the median for these 3 charts. Note however the price of the HUI is still below the 1x1 line on the weekly as posted a while back.

http://mscharts.pcqu...me=&lcprice.gif

http://mscharts.pcqu...me=&lcprice.gif

http://mscharts.pcqu...me=&lcprice.gif

So when I look at these charts, I don't see a lot of resistance once the highs are taken out.

The bearish case is for a "C" wave down in this wave II targetting a correction as low as HUI 145ish. That is one scary drop if it were to occur. But given the apparent HUI time cycles and the Gann charts above, you decide if this is likely to happen now or not.

cheers,

john
"By the Law of Periodical Repetition, everything which has happened once must happen again and again and again-and not capriciously, but at regular periods, and each thing in its own period, not another's, and each obeying its own law ..." - Mark Twain