
STMo long signal from 1184.0 ES...
Started by
tsharp
, Dec 09 2004 03:34 PM
4 replies to this topic
#1

tsharp
-
- Traders-Talk User
- 1,487 posts
Member
Posted 09 December 2004 - 03:34 PM
welp, i've messed with my hosting service long enough, and am unable to get my ftp to log in, and can't seem to upload files from with my account either... hmm.
anyway, my signals SARed back to long about 45-minutes ago @ 1184.0... for +4.0 on the last swing... oh well, that's the way the game goes sometimes too.
I sure hope that this breakout is the real deal, this choppy stuph is for the birds.
chart is attached, since i cannot get one uploaded to my server at the moment.
--tsharp
#2
tsharp
-
- Traders-Talk User
- 1,487 posts
Member
Posted 09 December 2004 - 03:53 PM
welp, i've messed with my hosting service long enough, and am unable to get my ftp to log in, and can't seem to upload files from with my account either... hmm.
anyway, my signals SARed back to long about 45-minutes ago @ 1184.0... for +4.0 on the last swing... oh well, that's the way the game goes sometimes too.
I sure hope that this breakout is the real deal, this choppy stuph is for the birds.
chart is attached, since i cannot get one uploaded to my server at the moment.
--tsharp
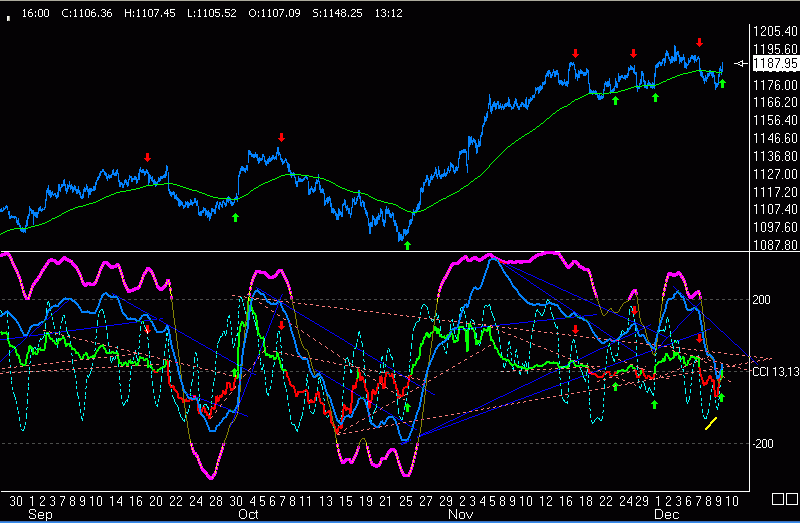
finally... got the chart uploaded to my server... see below.

#3
tsharp
-
- Traders-Talk User
- 1,487 posts
Member
Posted 10 December 2004 - 11:28 AM
fwiw, not looking too bullish here... just take a looksy at the negative divergence that's been building in the left chart.
also of note is the way my momentum indicator is staying relatively near to the zero line.
chart attached.
--tsharp
Attached Thumbnails
#4
OEXCHAOS
-

- Admin
- 22,025 posts
Mark S. Young
Posted 17 December 2004 - 09:27 AM
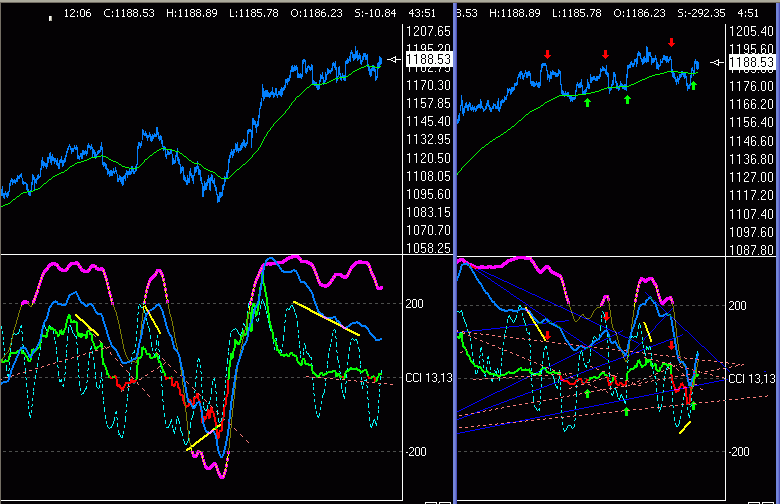
fwiw, not looking too bullish here... just take a looksy at the negative divergence that's been building in the left chart.
also of note is the way my momentum indicator is staying relatively near to the zero line.
chart attached.
--tsharp
Looks like your buy got right anyway!
I'll bet you're getting a Sell now, however.
Mark
Mark S Young
Wall Street Sentiment
Get a free trial here:
http://wallstreetsen...t.com/trial.htm
You can now follow me on twitter
#5
tsharp
-
- Traders-Talk User
- 1,487 posts
Member
Posted 17 December 2004 - 11:57 AM
fwiw, not looking too bullish here... just take a looksy at the negative divergence that's been building in the left chart.
also of note is the way my momentum indicator is staying relatively near to the zero line.
chart attached.
--tsharp
Looks like your buy got right anyway!
I'll bet you're getting a Sell now, however.
Mark
Hi Mark,
you're correct, the buy was just prior to a mini-breakout, as i had hoped...
i've learned the hard way that attempting to use EW/fractal analysis to generate ST swing/SAR signals is not very reliable... imho, EW is more of an art than a science. therefore, developing a relatively reliable swing system that is able to catch most of the meat between the peaks and valleys makes the most sense to me, which is what i've attempted to do with this hybrid momentum indicator swing system.
that said, you're correct again when you suggested that i got a sell/SAR signal this morning, it came at about 10:45 @ 1201 ES, for +17.0 on the last signal.
--tsharp


