Edited by tsharp, 19 December 2004 - 04:11 PM.

spx weekly...
#1

Posted 19 December 2004 - 04:06 PM
#2

Posted 20 December 2004 - 09:17 AM
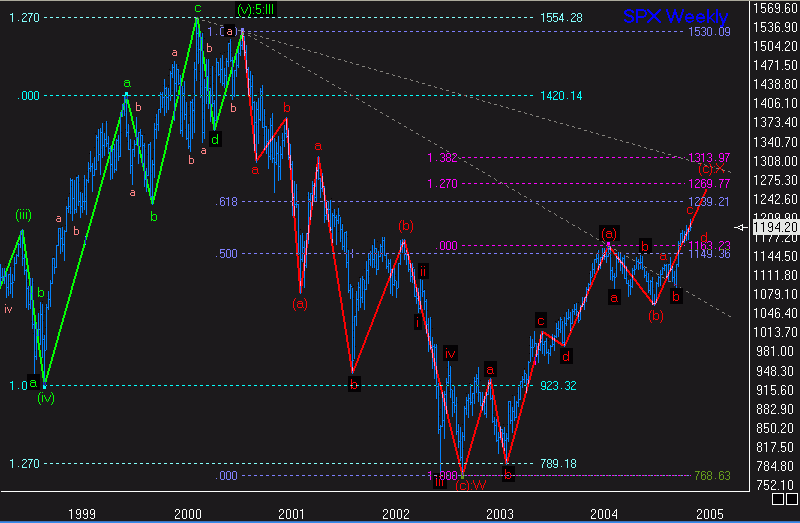
fwiw, attached to this message you will find a chart of the spx weekly with my current fractal analysis. if this analysis is correct, then we've begun wave-d of ( c ):X, which could be a shallow (contracting triangle?) or even a running correction... twt.
--tsharp
Absolutely interresting charts and analysis,thank you for posting and sharing the above
Good trading and HAPPY HOLIDAYS
pisces.
#3

Posted 24 December 2004 - 12:48 PM
fwiw, attached to this message you will find a chart of the spx weekly with my current fractal analysis. if this analysis is correct, then we've begun wave-d of ( c ):X, which could be a shallow (contracting triangle?) or even a running correction... twt.
--tsharp
Absolutely interresting charts and analysis,thank you for posting and sharing the above
Good trading and HAPPY HOLIDAYS
pisces.
you're welcome, and the best to you and yours also.
as with the daily spx, i'm updating the weekly spx to reflect a slight change in my EW/fractal analysis... but i'll also include a chart of the dow weekly.
--tsharp


