
*Interview with Ike Iossif on December 9: http://marketviews.tv/freeservices/archives1/Guests/Ord/pg1.htm
**Interviewwith Leo Leydon For January 5, http://financialfocusadvisoryservices.com/radio.html-click archive.
"TimerDigest" has Tim Ordranked #4 on returns for the S&P for one year, #3 for 6 month and #2 for 3 monthsending 11/12/04. "Timer Digest" has ranked Tim Ord as the top gold timer for the last12 months ending 11/12/04.
For 30 to 90 days horizon: Per intraday report onFriday, Sold long SPX (12/10/04) at 1188.00 for gain of 8.5% and now flat. Long SPX (10/25/04) at 1094.46. Sold long Nasdaq (12/10/04) at 2128.07 for gain of8.93% and now flat. LongNasdaq (10/21/04) at 1953.62.
For monitoring purposes: Long XAU, 87.96 on4/21/04.
Longer Term Trend monitoring purposes: Long SPX on8/19/04 at 1091.23. Possible target to old high near 1550 level.
What to expect now:
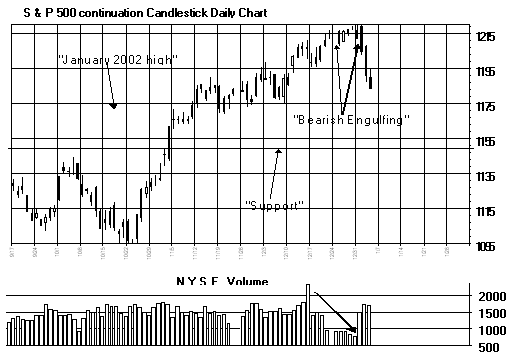
The "BearishRising Wedge" pattern that we have been talking about for the last couple weeksappears to have been completed on December 31 and the decline that follows has started. "Rising Wedge" patterns have downsidetargets to where they began and in the case of the S&P that would be near the 1160range. Notice that two bearish candlestickpatterns called "Bearish Engulfing" pattern was drawn near the highs (on thegraph above) and helped to identify the short term topping process. Also the Volume did pick up on the decline thatstarted Monday and implies the energy has switched to the downside near term. The McClellan Summation index is also heading downand implies the trend is now for now. Howeverthe McClellan Oscillator is nearing oversold levels near the -200 range closing today at-213. We will be looking for a positivedivergence in the McClellan Oscillator to help identify the next low, which we expect, maybe near the 1160 range. The larger time frame trend is up and will be looking to buy backlong on the S&P, probably between 1150 to 1170 area. Thenext potential run may take the S&P near the 1320 range before find the nextresistance zone. If this zone is hit in theApril time frame, which is also the 9 month cycle time frame, it would add to thepotential for a reversal. Sold long SPX(12/10/04) at 1188.00 for gain of 8.5%.
To learn more on"Ord-Volume" please visit www.ord-oracle.com.
Bought ISON on 12/2/04 at 4.00 and sold1/2 at 4.33 for 8.23% gain. (12/21/04) wesold the remaining 1/2 position at 6.00 for an average gain of 29%. Sold 1/2 eght at 4.20(60% gain) and have stop on remaining 1/2 position at 3.50. On 12/30, we bought SQNM at 1.36. Supportnear 1.20 target near 4.50.
Nasdaq Composite:
"Timer Digest" has ranked Tim Ord as the top gold timer for the last 12 months ending 11/12/04.
We have stated in thepast that the XAU may be drawing a "Head and Shoulders" bottom, where the"Head" is the May 10 low near the 77 level. Normally the Left Shoulder and Right Shoulder are symmetric in price andtime. It took five months to complete theLeft Shoulder and may take five months to complete the Right shoulder, which would extendto late January early February. The price lowshould be near current levels on the XAU according to "Price Relative To Gold"indicator and "Cash level" divergences on the Rydex Precious Metal fund. A lot the time anniversaries are important turndates. Last year top came in January 6 and tomorrow is also that date and could mark animportant low.
We double our positionsin BGO on (7/30/04) at 2.34 and we now have an average price at 2.70. Long CBJ for anaverage of price of 2.89. Long NXG average of 2.26. We doubled our position in GSS on (7/30/04) at 4.04 and we have an average price of5.24. Gss is not acting well for the moment. Nochange for now. Long PMU at average 1.12.
The McClellan Oscillatorclosed today's at -213 and in oversold level.
The “Percent Volume”Indicator closed at .34 and near the buy level.
“Five day ARMS”indicator closed at 7.24 and in the buy area.
Conclusion:Support near 1160 on S&P and 2090 to 2050 on Nasdaq.
Longer Term Trend: Long SPX on 8/19/04 at 1091.23. Upside target to old 2000 highs near the 1550level.


