Posted 10 January 2005 - 10:21 AM
 S&P 500 CASH
SPX CASH: 5-Day Projected Support andResistance levels: High - 1202; Low - 1166
MARCH SP: 5-DayProjected Support and Resistance levels: High - 1204; Low - 1168
SPX CASH: Monthly ProjectedSupport and Resistance levels: High - 1236; Low - 1192
SPX CASH: Yearly ProjectedSupport and Resistance levels: High - 1292; Low - 1135
From last week: "Withthe 45 day cycle currently seen as up and the 90 day cycle seen as down, we have mixedindications here, but the 1188 SPX CASH number is still the key dividing line between theup and down phases of these two cycles; in other words, if this number were to be takenout on an intraday basis, then the probabilities would favor that the down phases of bothof these cyclic components would be in progress. Otherwise then, as noted in recent weeksabove this same 1188 area and the market is going to continue to behave bullishly for thetime being. That is, if 1188 is taken out south, then assume the down phases of the 45 and90 day cycles are in progress and a test of 1150-1170 support is going to be seen. If, onthe flip side, we are testing monthly support by January 10th orso and we reverse higher off the same, then assume one new slingshot higher is going to beseen into the third week of the month for another try at a 45 and 90 day combo top."
Currentanalysis: Lastweek the SPX took out the key support area of 1188 SPX CASH, which is our top indicationthat the downward phases of the 45 and 90 day cycle components are in progress. Noted thenas well, taking this area out to the downside should normally indicate that a 3.8% to 5%correction or better is in progress into these cycle lows - which should form theirtroughs anytime between now and the first week or so of February.
The Cycles
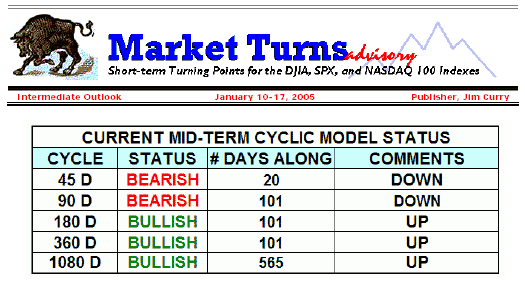
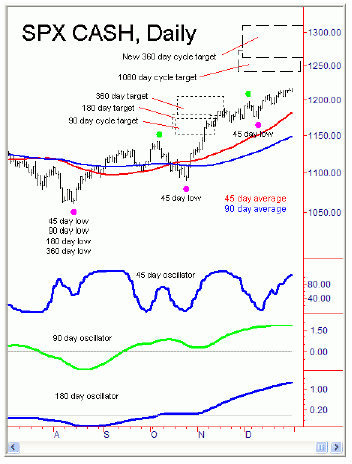
Fromthe cyclic table on page 1, the 45 day cycle is now seen as 20 trading days along and hasflipped to a bearish labeling - along with the 90 day cycle, which is currently 101 daysalong and is also seen as bearish. The larger 180 day (9 month) cycle is 101 days alongand is seen as neutral, while the 360 day component is still seen as bullish and shouldremain so into the summer of 2005. As per recent months, the combination of all of thecycles from our table is still looking for some kind of peak in March/April of 2005 andsome test of the 1238-1272 region, which is the outstanding upside projection from the1080 day component that was originally given in the Spring of 2004. There is also aremaining upside projection from the 360 day cycle to 1258-1310 SPX CASH, which is goodthrough October. The above indicate higher highs should be in store for 2005.
The 45 & 90 day cycles
Even though higher highs are expectedto be seen into the summer of this year, as noted last weekend we would expect to seeseveral corrections along the way. The first such correction was expected to be seen withthe 45 and 90 day cycles, and the break below 1188 SPX CASH was our indication that thiscorrection south was in progress. So far it has actually been a struggle to get solidlybelow the 1188 area, but the normal statistics should indicate lower lows will be in storefor the next week or three.
From last week: “Ishould add that of a more secondary note is the ‘ascending triangle’ patternthat is forming on the daily chart above, which is usually a more bearish formation if thelower trendline were to be closed below in the coming days. If this line were to be closedbelow, then the probabilities would quickly begin to favor a test of the 1188-1192region/path. Something to watch for in the coming days and as we begin the new tradingyear.”
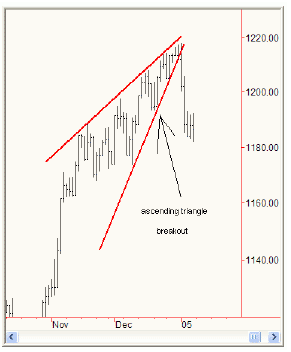
Current analysis: The SPX didclose below the ascending pattern early last week, making both a key reversal on the dailycharts - and the weekly chart as well. In other words, the index opened to make new swinghighs for the move - and then, just as quickly, reversed to make a weekly close below theprior week’s bottom. This is the classic definition of a ‘key reversal’ tothe downside, and is a pattern most commonly seen at cyclic tops.
Goingto the statistical analysis of the 45 and 90 day cycles, 80% of the 45 day down phases inrecent years have seen drops of 3.8% or better off the top, which would tend to indicateabove-average odds of a test of the 1171 region or lower could be seen on this downwardphase. Going to the larger 90 day cycle - which should be the cycle that ends up bottomingthis correction - the smallest drop with this component in recent years has been 5% offthe top, which could indicate a test of the 1156 region might be coming up as well. Inaddition to the notes above, we know that a cycle will tend to revert to a moving averageof the same length better than 85% of the time before that cycle bottoms. Since we knowthat the 90 day component is the largest cycle that is responsible for this decline, the90 day moving average on the daily chart is now acting as the price attractor for thismove. All of the above is valid providing that the 1217 swing top holds any near-termrallies; if that number were to be taken out higher then it would be our automaticindication that the downward phases of the 45 and 90 day cycles are complete and that theup phases of the same would be back in progress and heading into a March price peak.
The 180 and 360 day cycles
Thecombo of the 180 and 360 day cycles last bottomed in August of 2004 at 1060 SPX CASH andthe same should hold up into the Spring of 2005 and more likely into late-summer of thenew year (with the 360 day cycle). As per the notes from recent weeks, we know that thenormal up phases of the 360 day cycle have seen rallies of 20% or greater in recent years,which is in agreement as well to the four year cycle ‘second phase‘ rallystatistics - which are also giving above average odds for an eventual rally of 20% off theAugust 2004 lows. From the 1060 swing low from August 2004 this would target a possibletest of the 1272 region or higher before this 360 day component peaks out in 2005, whichis in agreement with the current upside target of 1258 or higher from this same cycle.
From last weekend: “As per the notes from lastweekend, I still think that the 1160 area is probably not going to be solidly taken out south until the upward phase of at leastthe 180 day cycle is completed by earlySpring of 2005. You can give this 1160 area a normal plus or minus variance of 10 points in either direction, making this supportthen actually in a viewed range of 1150-1170 SPX CASH.If a correction south into the next 45 and 90 day cycle lows were to be seen into thisregion, that should be expected to hold offthe decline into those cycle bottoms, and then higher highs should be expected to be seen by Spring and then again into the Summermonths.”
Currentanalysis: Inthe last few weeks I have made continual note of the support region which is in an actual wide range between the 1150-1170 area.Remember that the 1173-1174 region is the breakoutof the massive ‘double top’ from the year 2002, and is now acting as firstsupport to any move lower. Just below that wehave the 1163 area, which was the March top from 2004 and is then the subsequent break to new 52-week highs seenback in the month of November; this area is also anotherimportant range of support. Lastly, the 90 day moving average is currently at the 1153region and is rising slightly each day andwill also act as support as well if the larger cycles are pointed up into mid-year. In other words, if the combo of thecycles from the table on page 1 is going to hold up intoJuly or later of this year, then this 1150-1170 region should hold off the downside in thenext 1- 4 weeks.
The monthly chart above - shown many timesin recent months - continues to forecast anElliott-wave 5 to the upside into the nextfour year cycle top. Our VTL line shown inred has actually moved up to the 1133-1140area on a closing basis for the month ofJanuary 2005 and will move up even further tothe 1160-1165 region in the month ofFebruary. This indicates that if the recentuptrend is going to continue to have legsinto the summer months, we should see a closeat or above the 1140 area at the end of January and above the 1160‘s in February. By the end of March it will move up to the 1180 region or higher.
Asper the notes from recent weeks this redtrendline should not be taken out on a closingbasis as long as the larger cycles up to andincluding the four year cycle are pointingupward. Should it be taken out on a closingbasis in the coming months, it could be anearly indication that the upward phase of thefour year cycle is completed and that thedownward phase of the same is in progress.This is not expected to be seen before Spring of 2005 at least, and more likely will not be seen until some point later inthe year with the cyclic projection model looking for a peak on or after July of 2005.
The 4 Year (1080 day) Cycle
Asper the detailed notes on the four year cycle from last weekend, we know that within thefour year cycle’s ‘three-phase’pattern we likely saw the ‘phase one’ low at the August 2004 price bottom at 1060 SPX CASH. If that is correct, then we are inthe upward moving part of the second phase of the fouryear component right now. We know that 90% of these second phase rallies have not peaked out before seeing an eventual rally of 20% offthe first phase low, which here would target an eventualtest of the 1272 region or higher. We also know that 80% of these have not peaked before 6 months from the prior first phase bottom, whichwould indicate that a second phase top will not be seenuntil February of 2005 at the earliest - while the actual time cycle forecast ispinpointing July or later for this top.Lastly, we know that 80% of the four year cycle second phases have peaked at 14 months or earlier, which would tend to indicatethat this top should not be making a higher high past October of 2005. As well, we know that, statistically, the odds favor thefour year cycle will peak with this secondphase top. Thus, the inference with all of the above is that the four year cycle shouldform it’s peak between July and Octoberof 2005 - and then see a 20-40% drop off going into the next four year bottom in 2006 - and ideally bottomingin the August-November 2006 timeframe.
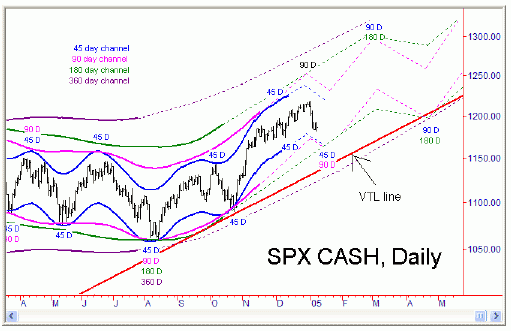
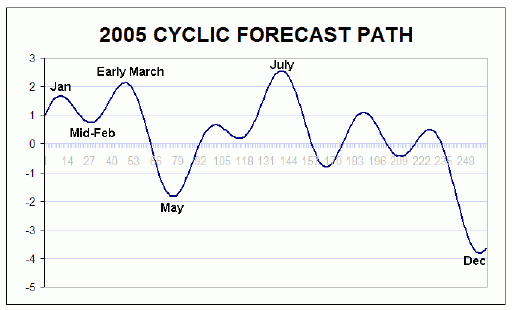
The chart above is a rough channel extrapolation of how price action may play itselfout in the coming months with the interactionbetween all of the cycles from the table on page 1. The current drop with the 45 and 90 day cycles is shownbottoming anywhere in the 1150-1170 range in the nextweek or three. In red I have also drawn in the same VTL line that is shown on the monthlychart from the prior page, so that we can seewhat area price must stay above on any corrections to continue the larger uptrend into summer. You can see that after the currentcorrection plays itself out, prices shouldmake a run to or above the recent highs going into early March - and then from there experience another solid correction into the next180 day cycle low that is due in early May. From thereone final slingshot to the upside is seen into July and October of 2005 into what couldend up being the larger four year cycle top.
January Seasonality in Post-Election Year
6out of the 10 (60%) post-election year January’s have ended the month to the upside,giving us the possibility of another monthlyclose higher - but again is off the 70% statistics we have seen in recent months. The average close to the upside with theabove numbers was 1.6%, but removing the monthsthat closed lower the average advance was higher at 4.7%. If the month is going to end higher, the above statistics are inferring a closeat or above the 1231 area (using the 1.6% figure) to as high as the 1269 region (using the 4.7% figure). As noted last weekend, Ishould add here again that the probabilitiesfor a monthly close to the upside are only 60%, which is lower than we would want to see for a good reliability - especiallywith the time cycles in the position that they are in.
Going to the intra-month statistics, 80% of the intra-month price rallies have been inthe 1.6% range or better - which wouldtarget a test of the 1230 area at some point during the month - while, on the downside, 80% of intra-months declines haveseen prices declining 1.5% or better at some pointduring the month; this latter figure suggested the statistical probability of a drop tothe 1192 area or lower, which was obviouslyhit with last week’s selloff from the highs.
With all of the above said and noted, I think the odds are actually about even for ahigher or a lower close for January, but theone thing that might end up as a net positive here is that we are seeing an early-month decline into support. Earlyday, early month, and even early year price drops tendto be more bullish than bearish - which could mean a late month reversal to the upsidemight be in the works. Again, whether that isable to bring the month into the black remains to be seen.
SPX/NDX Trader Commitment’s Analysis
As per last weekend, the commercials on bothindexes continue to be positioned bearishly. SPX commercialsactually covered 994 shorts last week - but still hold a large net short position overallat 48,707 contracts as of the closing oftrading last Tuesday. NDX commercials actually added a chunk of shorts last week, 5669 contracts to be exact,which brings their current net short total up to 17,374 contracts as of last Tuesday’s close. To me this is the most bearishthing that is hanging over the markets fornow - and, while I am still looking for higher levels in 2005, the commercial position is the best indication that the indexes are going tohave a tough time solidly exceeding their recent highs - at least until the bearish bets by the commercials are covered.
Theone last note that I want to add here in relation to the ‘smart money’ is thatperhaps the BEST indication of what the smartmoney is doing is with the cyclic Trendicator, which is published each day in the daily Market Turns outlook. Why would Isay this? Because this indicator was positioned bullishlyin the Autumn of 2004 - while, at the same time, the commercials were positioned on the short side. What happened? The index powered tothe upside, proving the commercials wrong in a bigway. The Trendicator issued a sell signal in April of 2004 at a price level of 1107 SPXCASH - just in time for the decline into theAugust lows - and then, on October 22, 2004 - issued a buy signal at 1095 SPX CASH, which was just in time for the hugerally that we witnessed into the 1217 SPX CASH high.In other words, the Trendicator has shown and has proven itself to be the better indicatorof what the smart money is doing in relationto the SPX. This indicator is available only in the daily outlooks - and I can tell you that it remains in a buy signal at the currenttime, but could also change at any pointgoing forward.
NASDAQ 100 INDEX
5-Day Projected Support and Resistance levels: High, 1600- Low, 1520
Monthly Projected Support and Resistance levels: High, 1657 - Low, 1599
Yearly Projected Support and Resistance levels: High - 1795; Low - 1461
Last weekend: “Forthe new month we have a new monthly projected support low of 1599 NDX CASH, which I give about 90% odds of being hit atsome point during the month. On the upside we havea new monthly projected resistance high of 1657 - which could also end up being seenbefore the month is out. However, if you area mid-term trader and are looking to the long side the 45 and 90 day cycle down phases can begin at any time andshould make a test of the 45 and even the 90 daymoving averages from our daily chart above. As with the SPX, there is a key dividing pricearea thatwill tell us that the down phases of these two cycles are in progress, and that number onthis index is 1566 NDX CASH. With this wecan assume that the index will continue to remain bullish above this level for now - but bearish if and when it were to be taken outlower, with the 90 day moving average actingas the price attractor should the lower number be taken out. In terms of time, the best spot to be on the lookout for a low toform might be near the January 10-11thtimeframe.”
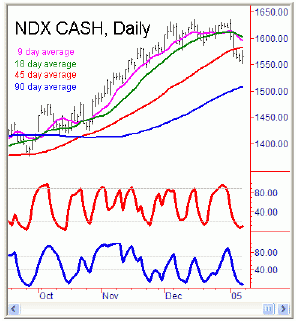
Current analysis: Last weekend I noted that the odds were about 90% that we would see the 1599 area on the NDX CASH hit before the month was up; that note was satisfied with last week’s action, as the index made a test of the 1635 swing top in Monday’s session - and then promptly fell apart into late week for a tag of 1551.29 at the lateweek price low. In doing so, the index also took out the 1566 area, which was noted here as the dividing line between the bull and bear phases of the larger 45 and 90 day cycles.
Withthe above said and noted, then we have toview the 45 and 90 day cycle down phases inplay on this index. Looking at thestatistical analysis of the down phases ofthe 45 day cycle on the NDX, 88% of these inrecent years have seen declines of 5% orbetter, while 77% have witnessed declines inthe 6.3% range or greater. With that, the higher statistic targeted a test of the 1553 area(which we saw last week), while the lower statistic targetsa possible test of the 1531 region or lower on this down cycle. In addition to the above,we 90 day moving average may also act as theprice attractor to this down phase - and this number is currently at the 1508 area and rising daily. Look for any new rallies higherto stall near the 1595-1605 region, which isa ton of short-term resistance here; if it holds, then continue to look for lower lows in the next week or three as these 45 and 90 daycycles bottom out - but then as well be on the lookout for the above support regions to be used as a buying opportunity headinginto Spring/Summer.
DJIA/DOW INDUSTRIALS
5-Day Projected Support and Resistance levels: Projected High, 10736 -Projected low, 10440
Monthly Projected Support and Resistance levels: Projected High, 11050 - Projected low,10601
Yearly Projected Support and Resistance levels: Projected High, 11405 - Projected low,10246
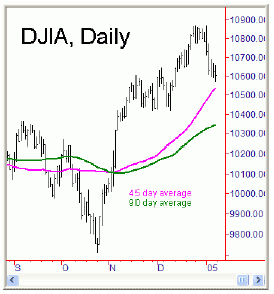
Last weekend: “We know that the odds are 85% orbetter for a return to either the 45 or 90 day averageshere - or both - which means that the probabilities again are starting to weigh in favorof a decline here. Having said that, any new decline on any or all of the indexes shouldbe viewed as a buying opportunity, as we knowthat the probabilities favor higher numbers will be seen by Spring and even into the Summer months.”
Current analysis: As per the notes from last weekend, a correction was ‘drawing nigh’ with the DJIA - and a correction back to the 45 and 90 day moving averages was likely to be in the cards at some point. Last week saw the DJIA making a test of it’s recent 10,868 high - and then quickly failing on that test for a quick decline into Friday’s session. At the lows for the week the index tagged 10,571, which was just shy of the magenta 45 day moving average on our daily chart at left.
Sowhat’s next here? The weekly projected resistancehigh is near the 10,736 area, plus or minus40 points in either direction. In other words,look for any new rally higher to stall at orbelow this region, and then to make a run toor below the low end of the range in the comingweeks as the 45 and 90 day cycles work onforming their lows. The 90 day moving averageis still at solidly lower levels here - andthough there is no actual requirement that weget it down that far - a cycle will usually revert back to a moving average of the same length a high percentage of the time. If theindex does manage to get down into this lower area,it should be a good buying opportunity for a try at higher highs going into theSpring/Summer months. Stay tuned.
JimCurry
email me: jcurry@cycle-wave.com
website link: www.cyclewave.homestead.com
Disclaimer:
The financial markets are risky. Investing is risky. Past performance does not guaranteefuture performance. The foregoing has been prepared solely for informational purposes andis not a solicitation, or an offer to buy or sell any security. Opinions are based onhistorical research and data believed reliable, but there is no guarantee that futureresults will be profitable. The methods Used to form opinions are highly probable and asyou follow them for some time you can gain confidence in them. The Market can and will dothe unexpected, use the sell stops provided to assist in risk avoidance. Not responsiblefor errors or omissions.
About Market Turns and Market Charts:
Jim Curry is a trading systems designer and day trader and edits Market Turns cyclicadvisory. Market Turns advisory service specializes in cyclical analysis
and defining market turning points, using cycles, Gann analysis, Harmonics, Elliott-wave,and technical statistics.
Each week he discusses when each cycle is likely to peak or trough, how far we are in thetrading cycle, also what price projections are likely to be hit while the cycleprogresses. Knowing these periods of projected strength or weakness - days, weeks, andeven months in advance is the most valuable information you can have as a short-termtrader.
Larry Tomlinson has been involved in technical analysis of the Markets since 1986. Hissystem of four technical methods combined with the five Market Risk Models allow theinvestor to minimize loss of capital during periods of high risk to market declines.Assets are moved into secure Money Markets during high risk and as risk improves andtechnical methods confirm, assets are returned to the Markets.
Market Charts analysis is based on four methods. Larry uses two systems of cycle timing,Elliott wave to understand where we are in a market pattern, Fibonacci price relationshipsand some Gann methods to complete the system. Market risk management models are thenlooked at to suggest an asset allocation. This gives the individual investor informationand a better understanding of how to minimize loss of profits gained in bull markets(higher highs-higher lows) by being aware of risk. A greater total return is realized dueto low exposure in declining markets and aggressive exposure during low risk markets.
Bob Nicholas does the market breadth analysis for the primary trend of the market usingthe McClellan oscillator and the intermediate breadth momentum oscillator. His analysis ofthe health of market breadth will keep trend traders on the right side of the market.
The team of Larry, Jim and Bob provides the information for a life time of risk managementof your retirement accounts, switch fund trading for intermediate term swings, futurestrading for day trading including all the tools required for beginners and experts on thefloor.
What you get:
An e-mail subscription to Market Charts/Market Turns provides the following two levels ofservice: Weekly and Daily.
Weekly Commentary
* Long term risk models for 401K and IRA management
* A weekly Dow and Sp500 chart and analysis summary by 6 PM Sunday
* Six to eight charts with technical commentary using Elliott, Gann and Japanese chartingmethods
* A weekly Long Term Market Risk Management summary as conditions merit
* Market Turns Cyclic model look ahead for future cycle turns
Daily Commentary
Daily charts and analysis of the SP-500 futures, NDZ Daily 60 minute chart of the S&P500 with analysis Daily Support and Resistance Table of the S&P 500 index Market Turnsanalysis of short term cycles and our exclusive "CYCLE OSCILLATOR" Primary Trendmodel for switch fund traders Short term Trend model for day trading Real time analysisand day trading using the cycles and Trend Models Pre Open analysis and comments for thedays trading, support and resistance levels, market pattern for the day Daily NYSE breadthanalysis of the McClellan Oscillator and the Intermediate-Term Breadth Momentum Oscillator(ITBM) for trend traders.


