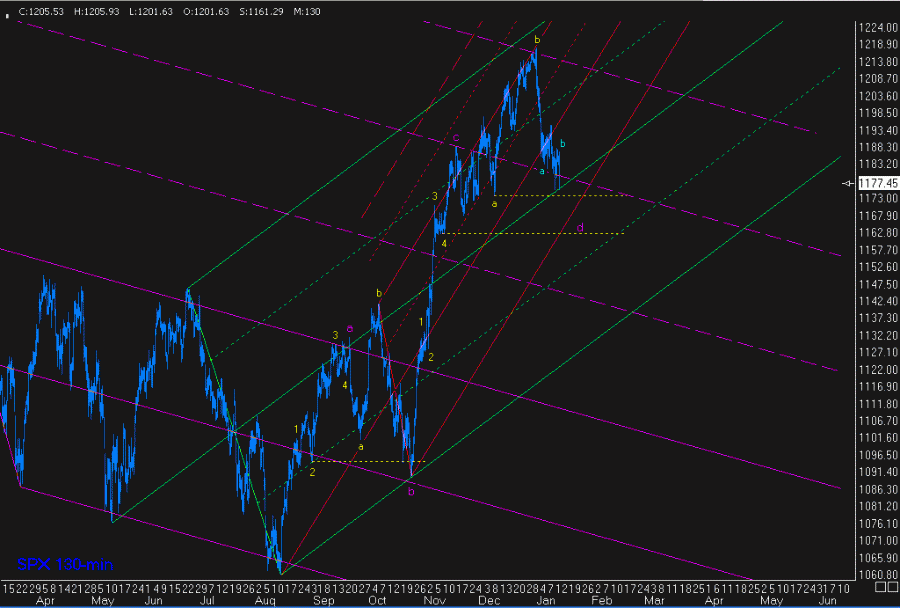
imho, there are several ways to interpret the current EW/fractal patterns, so i will just offer a few here, from my continued ST bearish bias that a potential larger c-wave down to complete wave-d:( c ):X:IV.
one approach is that a 1-2, 1-2 completed this afternoon with a failed wave-c:ii, thus a broken wedge and wave-iii:iii downward accelerated the plunge into the close.
another approach is that a wave-i, running wave-ii completed this afternoon, with a failed wave-c:ii, so a wave-iii is now in progress.
finally, and probably what i lean towards the most at this time, is that this move down is going to end up an EDT (ending diagonal triangle), of which wave-a and wave-b are complete, and wave-c is now in work, but will not necessarily be longer than wave-a in length, dropping perhaps to the low 1160s.
if this is a correct take, then a wave-d would ideally carry the price level back up into the range of wave-a, giving a wave-a/wave-d overlap, and then finally a short wave-e to nominal new lows, or even failing, would complete the downward pattern.
now understand that this is all based on conjecture... nothing is written in stone, but it appears to me to be at least a strong possibility for the future path of the spx... as always, twt.
--tsharp
chart attached.

spx 130-min...
Started by
tsharp
, Jan 13 2005 05:43 PM
No replies to this topic


