fwiw, my short-term momentum model just gave a SAR signal at 1173.50 at 11:00 for +1.0 on the last swing.
it appears at this moment, that the high yesterday was a wave-e:c:iv, or else we're still in a more complex wave-iv, but by the former interpretation, we've already completed a wave-i, wave-ii and have just begun a wave-iii down... twt.
will post a chart later.
--tsharp
P.S. posts from the other site:
tsharp . . Fri, Jan 28, 10:46AM ET
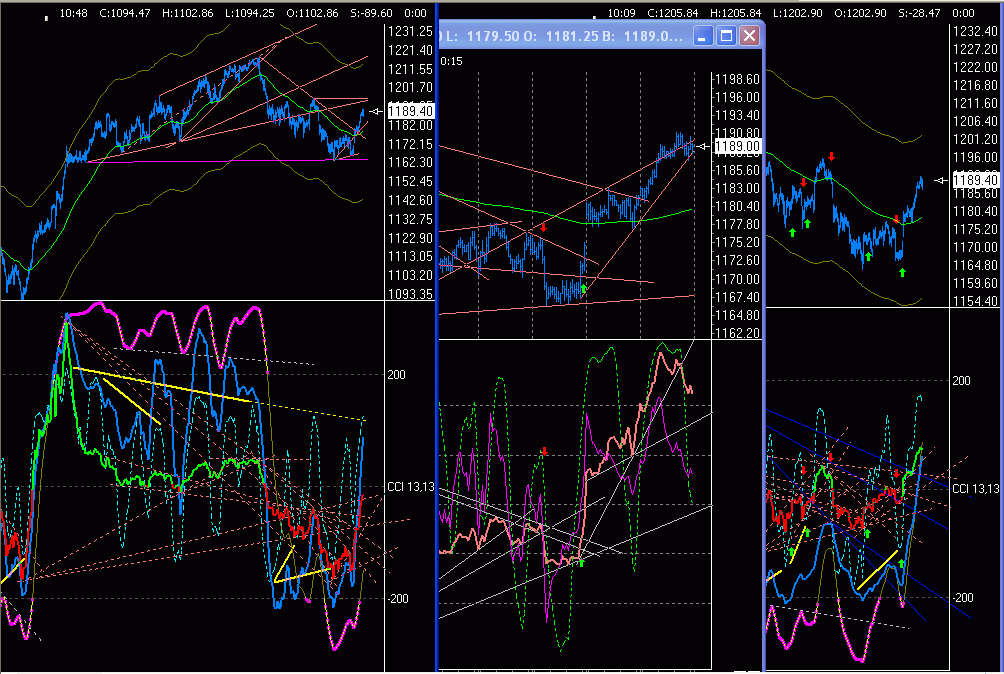
oh the precision with which they play their games... look at the ES chart in the middle, the intersection of the two TLs, if it were broken to the downside, that would have taken my stuph back to the darkside:

tsharp . . Fri, Jan 28, 10:48AM ET
it's really hard to see this kind of market action as bullish... yes, it's coiling, but for a breakout in which direction? looks down, but could go up
tsharp . . Fri, Jan 28, 10:51AM ET
spx chart could still be interpreted as wave-e:c ending at the high yest, with a wave-i, wave-ii down in place
tsharp . . Fri, Jan 28, 10:53AM ET
right back on that UTL on the ES chart... ~6-min to go on the bar
tsharp . . Fri, Jan 28, 11:13AM ET
needless to say, my stuph went over to the dark side... ES 73.50... +1.0 on last swing
tsharp . . Fri, Jan 28, 11:14AM ET
also, the interpretation of wave-e:c is in play, so this would be a wave-iii down