Jump to content


Photo

The Ord Oracle 2/17/5


  • Please log in to reply
No replies to this topic

#1 TTHQ Staff

TTHQ Staff

    www.TTHQ.com

  • Admin
  • 8,597 posts

Posted 17 February 2005 - 03:26 PM


*Interview with Ike Iossif on February 4
http://marketviews.tv/freeservices/archives1/Guests/Ord/pg1.htm

**Interviewwith Leo Leydon For February 16  , http://financialfocusadvisoryservices.com/radio.html-click archive.
"TimerDigest"has Tim Ord ranked #5on returns for the S&P and #2in Gold for 2004.

For 30 to 90 days horizon:
Flat.


For monitoring purposes:
Long XAU, 87.96 on 4/21/04.


Longer Term Trend monitoring purposes
:Long SPX on 8/19/04 at 1091.23. Top may form in April 2005.


Secrets from profiting with Price and Volume. 
Learnthe trading rules I use that made me #5 in the S&P and #2 in Gold in 2004 (By TimerDigest).  April 9 & 10 at the DenverMarriott tech Center.  Clickon www.ord-oracle.com or Call forsign-up (402) 486-0362.


What to expect now:


We have included a graph of the SPY (S&P 500 SPDRs) (Courtesy of www.decisionpoint.com). You can see as the SPY rallied form the lateJanuary low to it's current high, the volume gradually contracted.  This condition shows the force of the up-move isdecreasing and a bearish sign.  If the SPYtest the January 3 high at 121.76 and then closes below that high and volume shrinks near8% or greater against the January high on that test, it will trigger a short term bearishsignal.  This short term bearish signal wouldhave a downside target down to the previous high of mid January near the 119.50 range.  To negate this possibility, the volume needs topickup nearly 60 million shares on the test of the January 3 high.  The SPY has not touched the 121.76 area andtherefore no signal has been triggered.  Butif the 121.76 is tested and volume comes in near 55 million shares or less, it will implythe S&P will stage a pull back.  If theSPY does generate a short term bearish signal, it would only imply that a trading rangehas developed, where 119.5 is support and 121.76 is resistance. Therefore we are not expecting any seriousdamage here. The NYSE McClellan summation is trending up and implies the short term trendis up and implies the 121.76 area will be at least tested.  We will see how that area is tested.  We are staying flat for now and watching the121.76 on the SPY.  On the bigger time framewe think the market will work higher into late March to early April where and intermediateterm top may form.


To learn more on "Ord-Volume" please visit www.ord-oracle.com. 


Nasdaq Composite:

TheNasdaq uptrend is intact so far and could rally to the resistance zone near the January 18high at the 2106 area.  Volume was goodyesterday when it broke to a minor new high for the last couple weeks and implies itshould head to the next higher high to January 18 high of 2106.  The Nasdaq McClellan Oscillator is showing a shortterm negative divergence and implies the short term up-trend may be weakening.  If the Nasdaq Oscillator goes into negativeterritory while the 2106 is tested on lighter volume a short term bearish signal could gettriggered.  If a sell signal gets triggeredthe next support lower comes in near 2040 range.  Wewill be watching the 2106 range closely.  Stayingflat this index for now.
GOLDMarket:

"Timer Digest" has ranked Tim Ord as the
#2 gold timer for 2004.


The XAU and the "Dow Jones US Precious Metal" index triggered buy signals on theWeekly charts last Friday.  This buy signalmay last for 9 months or longer.  We believethe gold issues have turned the corner to the upside and the next impulse wave to theupside has started.  


We double our positions in BGO on (7/30/04) at 2.34 and we now have an average price at2.70. Long CBJ for an average of price of 2.75 (added to CBJ on 2/4/05 to bring averageprice to 2.75). Long NXG average of 2.26. Sold  GSSon 2/4/05 for 44% loss and took proceeds and added to CBJ. Long PMU at average 1.12.
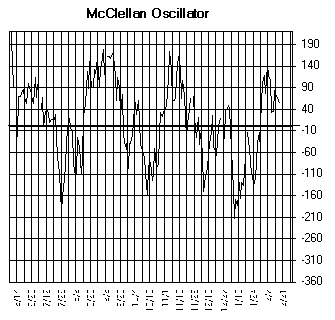


The McClellan Oscillator closed today's at +53 and neutral.


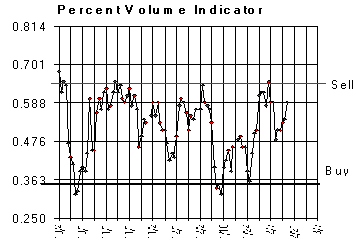
The “Percent Volume” Indicator closed at .59 and near the bearish level.


The "5 day ARMS" close today at 4.46 and neutral.


Conclusion: Up-tend intact so far.  Possibletop may form in April.

Longer Term Trend: Long SPX on 8/19/04 at 1091.23.   Mayclose this position at the April high.


Secrets from profiting with Price and Volume.  Come learnthe trading rules I use that made me #5 in the S&P and #2 in Gold in 2004 (By TimerDigest).  April 9 & 10 at the DenverMarriott tech Center.  Click on www.ord-oracle.comor Call forsign-up (402) 486-0362.