
Equity Index Update
Friday April 1st, 2005
Today's U.S. economic calendar is busy and will begin with the key release, the March Employment Report at 7:30. The University of Michigan Consumer Sentiment data will follow at 8:45 and the March ISM Survey as well as Construction spending will finish the reports at 9:00.
The key to the market today is the Employment data which is expected to be around +220,000 while projections range from +280 to +140. Anything below +200k would be a surprise to both the equity and fixed income markets. Late yesterday, the Goldman Sachs payroll auction traded around the +213,000 figure and that may in fact be the best consensus estimate.
Within the report, the market will pay attention to the hourly earnings, which is expected to report at 0.2%.
Michigan Sentiment Preliminary index is forecast at 94.9 with ranges from 92.0 to 97.5.
The ISM survey is expected at 54.9 with ranges in estimates from 52.5 to 57.3.
The following scenarios are worth looking at as we progress throughout the trading session. Employment scenario - +300k or greater - ideally this would be met with a positive initial reaction followed by selling as players prepare for a 50bp rate hike in May. However, be wary, as after the first leg down I would anticipate some volatile choppy trading in a contained range.
BELOW +200k would most likely lead to a selloff followed by a relief anti rate hike bounce. I think this scenario has the best chance to produce a large move in the marketplace -- in this case higher. Anything in between these two numbers, +200k and +300k will produce a bit of a yawn, and most likely will yield to the opening of Q2 as the leader for equity index trading.
It is also worth noting the employment trading pattern which is outsized ranges for the first two hours of trading - typically be 30% over a 65 day period. Currently, on a hourly basis, the Standard Deviation in the SPM contract is at 5.45 points - this is over a two week period. However, this reading has been cut in half as we have settled in a range after the steep selling from the 1230 area in the SPM. It would not surprise me to see hourly ranges in the 10 point zone today. If these occur it is an opportunity to take offers or hit bids depending upon direction for daytraders.
--Stone & McCarthy (Princeton)--
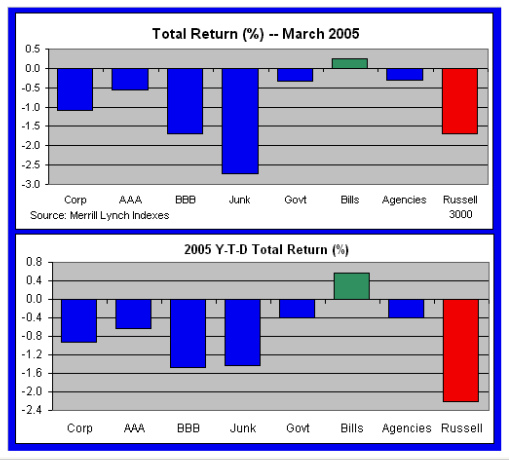
There is nothing funny this April Fool's Day about relative returns during the past month. Each fixed income and equity index we track in this monthly "Chart of the Day" update showed negative return in March, with the exception that staple for the most risk-averse -- Treasury bills.
Good Trading,
Brad
Sign-up for our 2 week Free Trial to read Brad Sullivan's Commentary every day by clicking here: http://hamzeianalyti...num_details.asp


