
CURRENT OPINIONS
STOCKS: Neutral short and intermediate term, and bullish long term. The market is now too oversold to bet on a continuation downward, although it could still happen. Change to short term bullish at the close on Monday.
T-BONDS: Bullish now short and intermediate term. Change to short term neutral at the close on Monday.
XAU & GOLD: Bullish short and intermediate term. Still looking for a pop out of this oversold condition before gold resumes the downward slope of this 5-year bear market. The smart money is now back to being short dollars, which should push the dollar down and gold up.
Three big events conspired to push the market into a near free-fall on Friday: there was a small bit of bad economic news, there was the breaking of support levels as we have been mentioning, and there was the monthly options expiration. Any one of these could have been survivable, but throwing them into the cauldron together caused a bit of a flash fire.
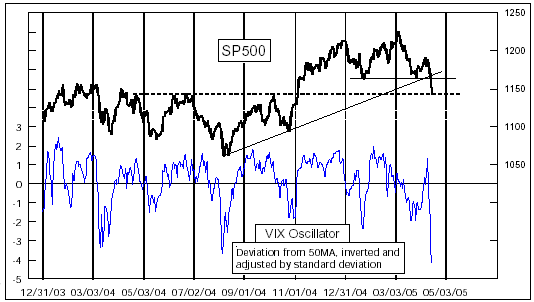

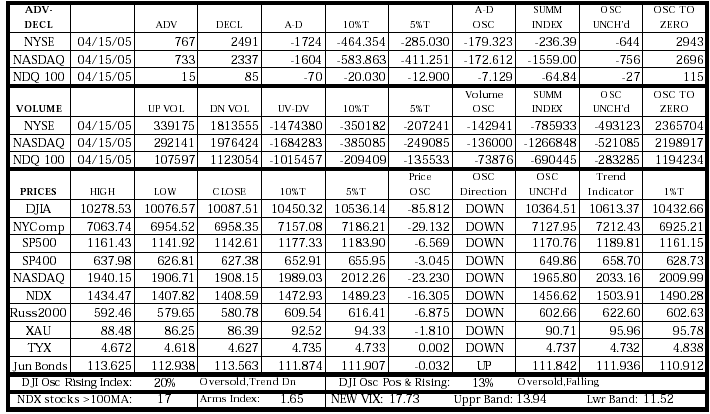
At the close, the DJIA was down 191 points for the day, and 420 points for the last 3 days. IBM led the way, falling 8.3% after reporting after hours on Thursday that it had missed first quarter expectations.
As we watched the day unfold, with terribly negative breadth, we figured that the market would not come charging back. Friday was a day for anyone who was going to sell to get that selling done. With support levels broken, with bad news out, and with a weekend looming to make traders nervous, the sellers came out. Given the reasons for people to sell, and the amount of selling that got done, we have to believe that most of the investors who were going to sell have done so. Any stragglers will probably get their selling done during the first hour of trading on Monday. The panic which infused the options market resulted in the VIX spiking up to 17.73, its highest value since Aug. 13, 2004.
Our first indicator looks at the VIX in a slightly different way. In past issues, we have shown the VIX compared to its 50-day simple moving average, along with volatility bands set one 50-day standard deviation on either side of that moving average. Our page 1 indicator just measures how far the VIX is away from that moving average, measured in units of those standard deviations. Friday’s closing reading was -4.12, which is the most extreme value we have seen since Sep. 17, 2001, the first trading day after the 9/11 attacks. Prior to that, we have to go all the way back to the mini-crash of October 1997 to find a similar reading. This is the sort of category that this selloff falls into.
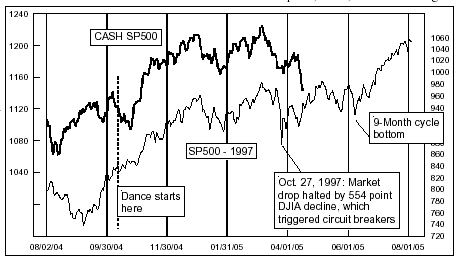
This is a bit early for the market to be finding THE BOTTOM, since the 9-month cycle bottom is not due to arrive until the end of May. That makes for a very interesting coincidence, since the Oct. 27, 1997 minicrash came a couple of months ahead of a 9-month cycle bottom due date as well. This led us to take a comparative look at the two periods, and the result is shown in the above chart.
When we first went looking to make this comparison, our thought was that the Oct. 27, 1997 minicrash day should line up with today. But when we got them on the chart together, we found that a better aligned could be found, as shown in this chart. This alignment puts Friday’s big down day in line with the post minicrash retest bottom that occurred on Nov. 12, 1997, and puts the minicrash day into alignment with the March 23, 2005 instance of the McClellan A-D Oscillator hitting -337. Even though the price structure relationship of these bottoms is not quite right, the McClellan Oscillator relationship is quite accurate. You can also look back over the period since mid-October 2004 in this chart, and see that the two patterns have been dancing together quite nicely.
The implication of this for the current market is that the 9-month cycle bottom due at the end of May should still be on schedule, and we may indeed have already seen all of the price damage that we are going to see for this cycle. And the 1997 instance is not the only example of the market completing the damage well ahead of the cycle low.
Back in 1987, we all remember how the market crashed in October. What you may not know is that the 9-month cycle bottom that year was due in early December, and sure enough there was a retest low on December 4, 1987 which roughly equaled the October 1987 lows. It was as if the market came to the realization that it had an important bottom to make in December 1987, and it went ahead and got all of the destructive work done in October 1987. No one can accuse the market of being a procrastinator.
Between October and December 1987, the indices just chopped around, killing time, while everyone talked about how it was 1929 all over again. Once the 9-month cycle bottom arrived in December 1987, and also in January 1998, the market got about its task of zooming upward out of those cycle lows.
So it is quite likely, in light of what we are seeing unfold, that the decline is now already over, and what’s left is just some chopping around, killing time, until the late May 9-month cycle bottom arrives and gives the market its release to start a real advance. For the short term, we could see an attempt by the market to dip its toe below the DJIA 10,000 level, just to help scare out a few more nervous bulls, but we ought to see a pop after that into a short term top at the end of next week.
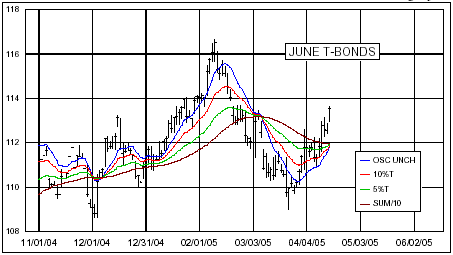
T-Bonds gapped up on Friday, as traders read the tea leaves of the overnight Globex trading of the SP500 futures and foresaw a bad day coming for stocks. Sure enough, the flight to quality pushed June T-Bond futures up by 1+1/32. Rather than having bond prices slide downward toward the point of the rainbow convergence as we suspected might happen, bonds instead spurted upward quickly to complete the convergence. This sort of action usually results in an end of the trend which led to the convergence once the lines all get together. That end to the trend may be an outright reversal, or just a temporary pause, something which events will reveal to us over the next few days. In any case, we’ll be changing to short term neutral on bonds at the close on Monday, as we wait to see which sort of post-convergence price activity bonds will undertake.
As for the COT situation in T-Bonds, which we normally address on Friday, the commercials this week backed off somewhat from their big net long position, but still have a long way to go before they get to the point where we would say that the rally should be over.
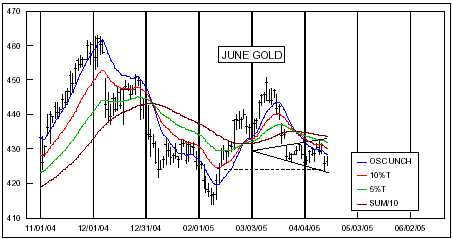
After Thursday’s big decline, gold prices appear to have caught themselves. The intraday low on Thursday turns out to have filled a pattern gap which was left on Feb. 14, making it a nice place to stop. What is also clear in a daily bar chart is that gold prices are forming a “broadening pattern”, which Edwards and Magee classified as a reversal formation. They noted that, “the Broadening Formation may be said to suggest a market lacking intelligent sponsorship and out of control--a situation which is whipped around by wild rumors.” Unlike a symmetrical triangle, which is an indecision pattern that usually results in a continuation of the prior trend, a broadening formation is a schizophrenic pattern, and usually a reversal.
Complicating this notion, however, is the fact that commercial gold traders moved incrementally further toward a big net short position in this week’s COT Report. That should be bearish for gold, although high net short readings can occur at the beginning of an up move. But it is also in conflict with what we are seeing in silver futures, where the commercials moved away from their big net short position, and now have one of the smallest net short readings in a while. The commercial gold and silver traders appear to be in conflict with each other over the direction of the precious metals market.
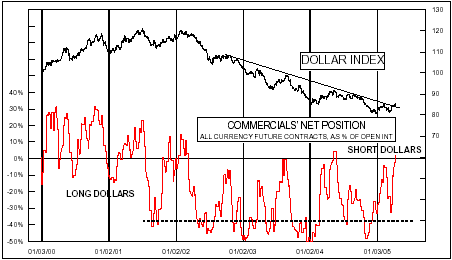
To break that conflict, we offer the final chart, which shows the composite position of commercial traders in all currency contracts. They are now back to net long for only the second time since the big Dollar Index top in January 2002. That last occurrence in May 2004 marked the high for the year in the Dollar Index. So it is quite likely, in our view, that the Dollar Index is topping now, and ought to be able to give way at least a little bit to allow gold prices to get up off the mat.
©2005, McClellan Financial Publications, Inc.


