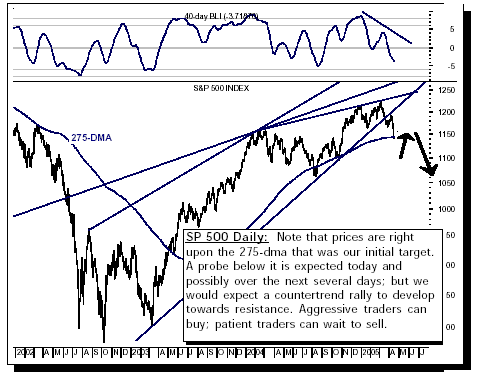

THE WORLD EQUITY MARKETS ARE ALL “SHARPLY LOWER” THIS MORNING:
And sharply does not do the declines justice; Japan was lower by -3.8%; with the rest of Asia lower by -2.0% or more. In Europe – the declines range from -1.7% to -2.5%. This is pure and simple ‘risk aversion’ on the part of nearly everyone; liquidity is being drained from the marketplace to be put into productive use in the real economy. Industrial loans are higher, other loans must take place…and this impacts equity and capital market trading at the margin. We believe a bear market in stocks has resumed after a relatively ‘brief’ several year respite, which means all rallies are to be sold. This is prudent, this is wise…and we will look to do so.
However, opportunities exist for those who are ‘aggressive and nimble’ per se; sharp rallies will develop from time to time which can and should be bought as the risk-reward dynamic is clearly defined. We think a point such as this is coming in the days ahead; and we look to take advantage of it by covering our profitable short positions and moving to a modestly aggressive long position with an eye upon becoming even more aggressive on the short side. Our primary targets buy targets are defensive shares such as Pharmaceuticals and Regional Banks; whereas our primary selling targets will be everything technology related.
THERE AREN’T ANY MAJOR ECONOMIC REPORTS TODAY:
The National Association of Homebuilders releases their monthly data for April; and we have no consensus figures or estimates. This will be the ‘next’ in a very short line of April figures to come out; the next will be Thursday’s Philadelphia Fed Manufacturing index. However, Tuesday will provide March PPI and Housing Starts; PPI is expected to have risen sharply by +0.6% vs. prior month’s +0.4% gain. And housing starts are expected to decline to 2.056 million annual units from February’s 2.195 million. If these numbers are substantially worse than the consensus – the current bearish sentiment will overwhelm equity prices in a substantial manner. Witness the past 3-day decline in the SP 500…-3.7%.
FRIDAY’S ECONOMIC REPORTS WERE RATHER ‘WEAK’ VERSUS CONSENSUS:
Looking at the Empire Manufacturing survey – it printed 3.1…the fourth straight decline and the lowest level in 2 years. This clearly reinforced fears that higher energy prices were slowing the current expansion; and who can discount the consistency of a 4-month trend. As for Consumer Sentiment from the great University of Michigan – it fell by 4 points to 88.7; with both current and future assessments falling rather abruptly. The culprit happened to be those with below median incomes and thus we can lay that front and center upon ‘higher gasoline prices’. All in all…higher energy prices are ‘crimping’ spending behavior after one year of higher prices.
TIC DATA SUPPORTS CURRENT ACCOUNT DEFICIT…BY QUITE A MARGIN:
In the past is over category; January showed foreigners were quite happy to continue exporting net capital on the order of $84.5 billion to the US to buy US treasuries and corporates; the not so fortunate asset classes were US agencies and equities. Conversely, US participants exported more capital as well – buying more foreign bonds and stocks. In all – the trend remains intact to fund the massive deficit by a rather comfortable margin. The question should be revisited in June when the data for April is released given the current ‘swoon’ in equity prices.
MODEL UPDATE:
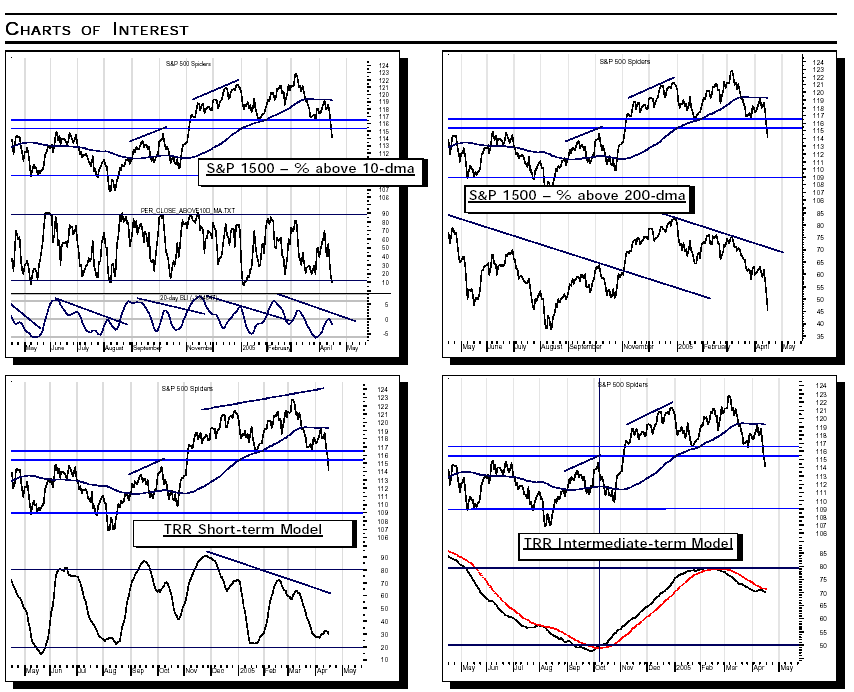
The current decline is accelerating; with sentiment becoming rather ‘bearish’. We look for this to subside in the days ahead with a sharp countertrend rally given an enormously short-term oversold condition. But make no mistake; the Intermediate-Term Model is pointed lower and quite far from what we consider an oversold condition; we sell all rallies.
But that said, the % of stocks above their 10-day moving average is belowe 10%...generally a precusor to reversal higher, although this make take several sessions to manifest itself. Also, the % of stocks above their 200-day moving average is near 40%...typically quite low and does argue for further corrective action.
CONCLUSION: Aggressive long positions should be considered in the very near future with tightly defined stop loss points.

[The rest is reserved for subscribers]
Good luck and good trading,
Richard Rhodes


