Jump to content


Photo

The Ord Oracle 5/5/5


  • Please log in to reply
No replies to this topic

#1 TTHQ Staff

TTHQ Staff

    www.TTHQ.com

  • Admin
  • 8,597 posts

Posted 05 May 2005 - 07:53 AM


*Interview with Ike Iossif on April 15  http://www.marketviews.tv/freeservices/archives1/Guests/Ord/pg1.htm
[font="Arial;color:blue"]"TimerDigest"[/font][font="Arial;color:red"] has Tim Ord ranked [/font]#5 on returns for the S&P and [font="Arial;color:blue"]#2[/font] in Gold for 2004. [font="Arial"]
For 30 to 90 days horizon: Covered short SPX on 5/2 at 1162.16 for gain 0% gain. Short SPX on 4/14/05 at 1162.05.  [/font]Covered short Nasdaq on 5/2 at 1928.65 for 1.1%gain. Short Nasdaq on 4/25 at 1950.78.

For monitoring purposes:
Long XAU, 87.96 on 4/21/04.
Longer Term Trend monitoring purposes: Short SPX (S&P cash)on 4/12/05 at 1187.76.
[font="Arial"]
What to expect now:


 [/font](Courtesy of www.decisionpoint.com) On the lastpage of this report we have displayed a graph of the NYSE McClellan Oscillator andSummation index.  Notice the Summation index(Marked in Red) made a lower high going into the March high as the NYSE made a higherhigh.  This is a major divergence on a bigtime frame and suggests the market made a significant high going into the March high andimplies the bigger trend is now down.  Shorterterm notice the Oscillator (marked in Blue) made a higher low than the previous low withthe NYSE making a lower low than the previous low.  Thisis a short term positive divergence and suggest the market should make a short termbounce.  Also notice at the bottom of thegraph (Circled in Orange) that NYSE Summation index is now trending up.  The Summation index is a good trend followingtool.  When the market is an up-trend theSummation index is also trending up.  Thereis a gap left open near the 1200 area on the S&P and we have found most gaps getfilled.  The S&P may find resistance atthis gap area and may be the place to look for another short position.  The longer-term trend is still down and we areholding our long-term short position on the SPX. Long 4/21/05 ENG at 2.25, moved stop to2.14 on 4/26. First target to 3.40.

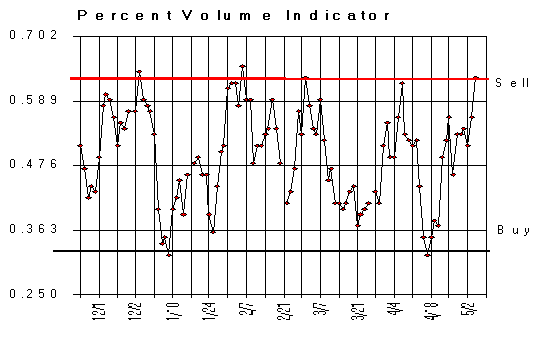
To learn more on "Ord-Volume" please visit www.ord-oracle.com. 
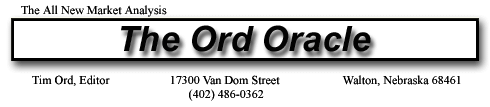

Nasdaq Composite:
[font="Arial"]
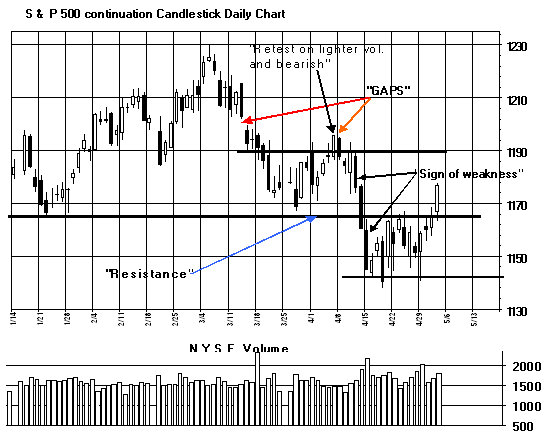
Friday, the Nasdaq tested the previous low set on 4/18  [/font]and volume shrank (compared to the 4/15 low) by 12% and a short term bullishsign.  This re-test of a previous low onlighter volume generated a bullish sign and we covered our short on the Nasdaq.  This potential bounce may take the Nasdaq to it'supside resistance near the 2000 range.  We maylook for a new short near the 2000 range.

GOLD Market:


"Timer Digest" has ranked Tim Ord as the #2 [font="Arial;color:blue"]goldtimer for 2004.[/font]

Short term trade, Long BGO (4/19/05) at 2.37.  This trade is separate from our long term positionin BGO.
[font="Arial"]
BGO tested the May 2004 low (1.97) on lighter volume this week.  [/font]If BGO closes above the May 2004 low of 1.97 onFriday of this week, it will generate a bullish signal that will have a minimum upsidetarget the December 2004 high of 3.87.  Wewould like to see CBJ test the 4/12 low near the 1.73 on lighter volume to complete thebottoming process. NXG is still looking for a bottom.  The "Price Relative To Gold" ratio hit below .19 recently andsuggests the gold issues are making a bottom.  Wewill see how NXG does on the next rally phase.  NXGcould be drawing a "Down Sloping Wedge" pattern that has an upside target toMarch 2004 highs near 2.58.  PMU went sideways into a trading range with boundaries between .50 and .80 form May 2004. A break above.80 with volume would suggest the next upside target to December 2003 high near 1.80.
We doubled our positions in BGO on (7/30/04) at 2.34 and we now have an average price at2.70. Long CBJ for an average of price of 2.75. Long NXG average of 2.26.  Long PMU at average 1.12.
[font="Arial"][/font]

[font="Arial"] The McClellan Oscillator closedtoday's at +132 and overbought for near term.[/font]
[font="Arial"] The “Percent Volume”Indicator closed .63 and overbought for near term.[/font]
[font="Arial"] The "5 day ARMS"close today at 5.21 and neutral for short term.[/font]
[font="Arial"] Conclusion: Bigger trend on theS&P and Nasdaq is down but expect a pop up near term.[/font]
[font="Arial"] [/font]LongerTerm Trend: Short SPX(S&P cash) on 4/12/05 at 1187.76.