| TD_Trader Daily Swing Wednesday 18-May-05 5:55 AM ET | Editor: Arthur Hill |
Early FuturesTrading (~5:50 AM ET)
NDX: -2.00
SPX: -1.00
US Dollar: 86.25 (+.04)
Gold: 419.50 (-.30)
Oil: 49.30 (+.33)
10Yr Note: 112 3/32 (+1/32)
Nikkei (spot): 10,835 (-10)
FTSE (spot): 4925 (+27)
-----------------------------------------------------
Short-Term Position/Trend Summary NDX/QQQQ: Bullish – Key Support:
SPX/SPY: Bullish – Key Support: 1158(115.95)
----------------------------------------------------
General Comments
|
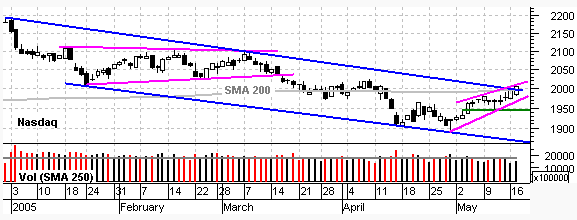
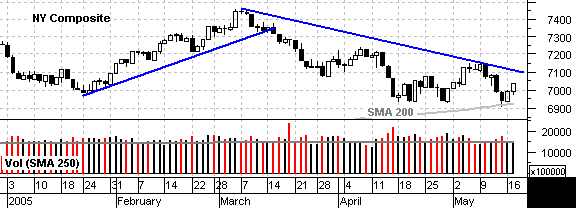
It is a tale of two markets – over the short-term (a few weeks) and over themedium-term (a few months). The NYSE Composite has been lagging the Nasdaq over the lastfew weeks, but has also been above its 200-day SMA and is currently finding support fromthis moving average. Meanwhile, the Nasdaq has been largely below its 200-day SMA, butmoved above this moving average and the January trendline yesterday. Medium-term, the NYSEComposite is the strongest index. Short-term the Nasdaq is the strongest index.
|
The move above 2000 should not be construed as a big resistance breakout. First, volumewas below average. Second, there is resistance around 2000 from the late March/early Aprilconsolidation. More likely, the Nasdaq has entered a resistance zone around 2000 andfurther advances will be laborious. The pattern since late April looks like a risingwedge. These are typically for corrective rallies that fail and a failure around 2000would fit the script quite nice (200-day SMA and trendline resistance). As long as thewedge rises and the lower trendline holds, the bulls deserve some respect. A move belowthe lower trendline would be negative and further weakness below last week’s low(1943) would be bearish.
|
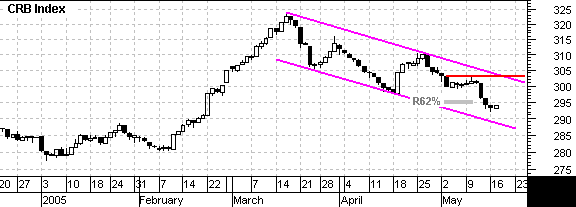
Commodities were the big winners from early January to mid March and the big losersfrom mid March to mid May. Despite the decline since mid March, the pattern (falling pricechannel or wedge) and the retracement (~62%) are typical for corrections. Should the CRBIndex firm around 295 and move above 305, the commodity bull would be back on track. Thiswould benefit Energy and Commodity related stocks. The US Dollar Index is likely to be thebig wild card though. Until we start to see some weakness in the US Dollar Index,commodities are likely to remain soft.
|
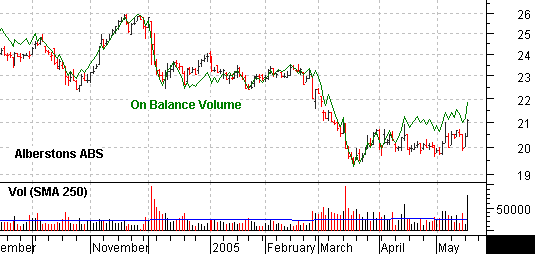
The grocery store stocks are attracting interest. Albertsons (ABS), Safeway (SWY) andKroger (KR) were all up on above average volume. ABS has been on my watch list for a fewweeks and broad strength in the group is quite positive. ABS consolidated over the last6-8 weeks and upside volume (black bars) was outpacing downside volume (red bars).Yesterday, the stock surged above 21 on the highest volume since mid March. The breakoutreinforces support around 19.5 and the first target is 25. This industry group is part ofthe Consumer Staples sector and strength here fits with the premise of a defensive marketthat favors non-cyclical stocks. ----------------------------------------------------
|
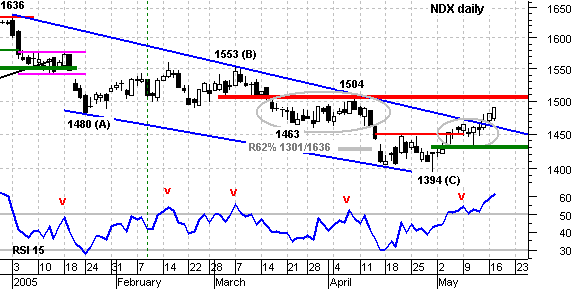
The bulls still hold the edge as the index moves towards the upper reaches of theresistance zone (1450-1500). I noted in late April and early May that the time to turnbullish would be on a move above 1450, not on a move above 1500. While a move above 1504would certainly be positive, low volume and relatively small advances show a lack ofconviction among the bovines. Perhaps this is just a wall of worry. This advance issimilar to the mid August low in that it lacks a big catalyst (high volume big move).Despite this hesitancy, I will stick with the bulls until proven otherwise with a movebelow 1430 in the index and 50 in RSI.
|
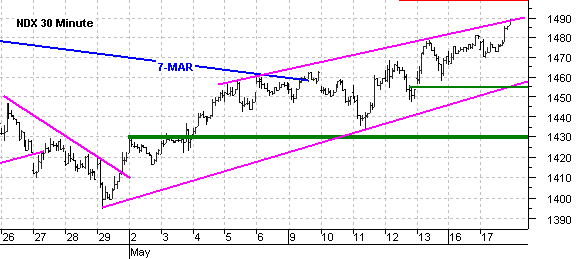
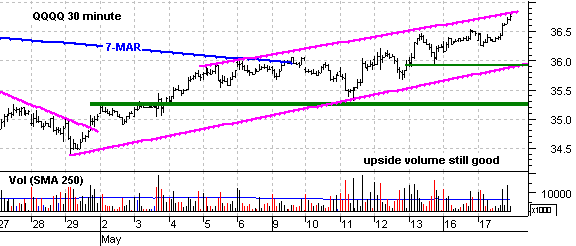
There is not much change on the 30 minute chart. The advance since 29-Apr looks like arising wedge and these are typical for corrective rallies. With the index near the top ofa resistance zone, traders should watch this pattern closely. As long as the lowertrendline holds (1455), the wedge is rising and the bulls are on firm footing. A movebelow 1455 would break the lower trendline and be the first sign of significant weaknesssince the 11-May dip to 1432. Even though negative, I still see a lot of support around1450 and will hold off before turning out right bearish.
|
Short-term Strategy:
All four tech groups are now participating in this advancewith Semiconductors and Networking leading the way higher. In addition, InformationTechnology is the top performing sector since 29-Apr and this is positive. The potentialproblem lies with the structure of the advance: a rising wedge at the top of a resistancezone. Even though these patterns suggest that the advance is slowing, it is still anadvance and turning bearish now would be jumping the gun.
|
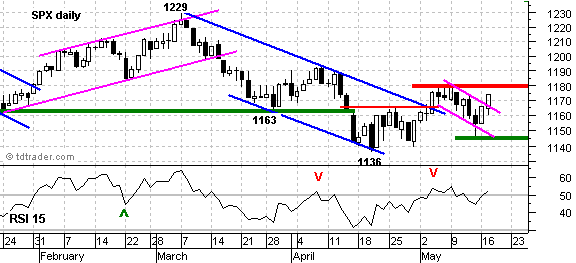
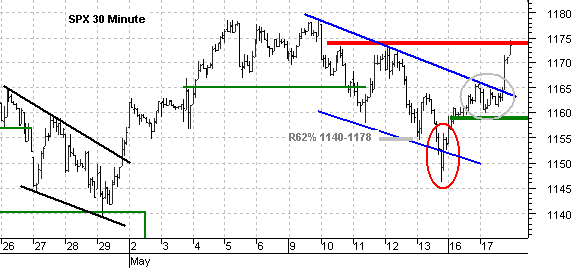
Led by a rebound in the Finance sector, the S&P 500 played a little catch upyesterday. The index formed a falling flag last week and broke above the upper trendlineyesterday. The move is positive and keeps the bull alive on the daily chart. Moreimportantly, the move reinforces support at 1145 and puts RSI back above 50. As long asboth of these hold, I stay bullish on the daily chart/trend (medium-term).
|
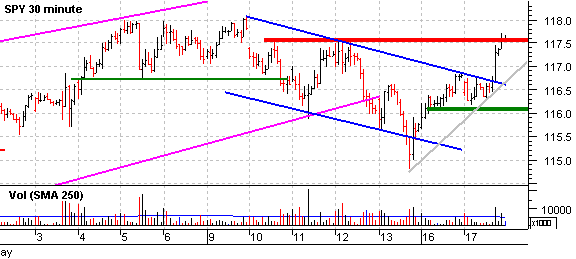
Perhaps the dip below 1150 on Friday the 13th was an over reaction (red oval). Theindex certainly recovered quickly and the pattern looks like a falling price channel (flagon the daily chart). 1155 marks a 62% retracement of the prior advance (1140-1178) and thepattern looks corrective. As such, the move back above 1166 and 1174 puts the bull back atthe forefront. Notice the consolidation around 1160-1165 yesterday and the afternoonbreakout. These show strength and key support is set at 1158. A move below this levelwould negate the breakout and turn my short-term stance bearish.
|
Short-term Strategy:
The sector rotationswithin the S&P 500 are playing havoc on the index and preventing a clear trend fromemerging. This is indicative of a selective market with no new money coming in. Low volumeconfirms that pundits are rotating among the sectors. A high volume advance would indicatenew money and the potential for a move that lifts all boats. At the risk of more whipsaw,I will turn bullish on yesterday’s breakouts at 1166 and 1174. A move back below 1165would be negative and further weakness below 1158 (SPY 115.95) would be enough to turnbearish and expect a move towards 1140.Good day and good trading,
Arthur Hill
-------------------------------------------------------
***Links***
http://biz.yahoo.com/c/e.html
http://www.cme.com/trading/dta/del/globex.html
--------------------------------------------------------
Breadth
About
Disclaimer:
Sources:


