*Interview with Ike Iossif on April 15
[font="Verdana;color:blue"]"Timer Digest"[/font]
[font="Verdana"]
For 30 to 90 days horizon:[/font]
[font="Verdana"]For monitoring purposes:[/font]
[font="Verdana"]Longer Term Trend monitoring purposes:
[font="Verdana"]
What to expect now:
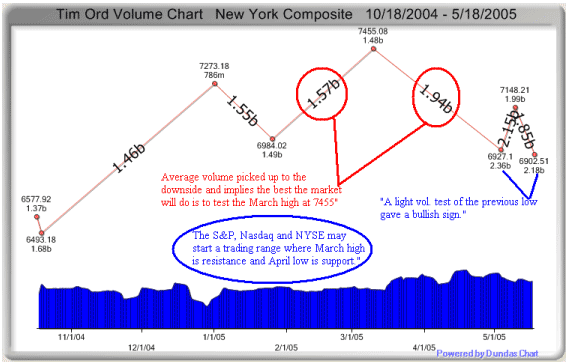
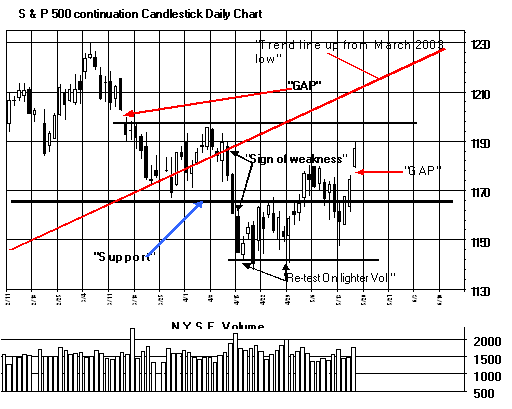
[/font]The NYSE Summation index is trending up and implies the trend has turnedup. Volume will be very important this week and will help us gauge if the rally isfor real on just a bounce in a downtrend. Today's volume did expand and implies therally can go higher. On the last page of this report, we have displayed a graph inthe Ord-Volume format. The Ord-Volume format measures the average volume betweenswing highs and lows and therefore measures the force in each swing. On the lastswing down into the April low the swing volume increased compared the last swing up intothe March high. This condition predicts the NYSE either is starting a significantdecline from the March high or is starting a trading range from the March high. Because of the recent volume increase to the upside, it appears a trading range hasstarted where the April low is support and the March high is resistance. Right nowwe are neutral but support comes in near the 1175 range on the S&P which is where agap formed and is also the previous high and previous highs are support. If theS&P pull back to 1175 on light volume, we could end up with a buy signal. Theminimum upside target will be 1200 (gap level) too as high as 1230 range, which is theMarch highs.
[font="Verdana"]
To learn more on "Ord-Volume" please visit
[font="Verdana"]
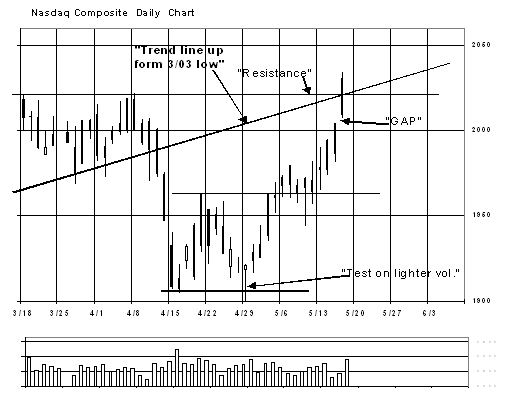
Nasdaq Composite:[/font]
GOLD Market:
[font="Verdana;color:blue"]
"Timer Digest" has ranked Tim Ord as the [/font]
Short term trade, Long BGO (4/19/05) at 2.37. This trade is separate from ourlong-term position in BGO.
We wrote a lengthy report on the XAU on Monday market letter. The Rally form the2000 low is not over on the XAU or gold. We have counted four Elliott waves up fromthe 2000 low and the XAU may be ending Wave 4 now. The Fifth wave and final wave upshould at least take the XAU to 150 and possible 180. That will be the time to takeour profits in our gold issues. We have had a longer-term target on BGO near the9.00 range and at the moment we see no reason to change that target. CBJ could go to8.00 and possibly to 15.00. If NXG can get through it's old high near 2.60; it couldgo to 8.00. NXG could be drawing a "Wedge". PMU appears to be at thebottom of it's trading range near the .50 level. We could end up with a bullishsignal on Friday near this level, depending how the volume does the rest of the week.
We double our positions in BGO on (7/30/04) at 2.34 and we now have an average price at2.70. Long CBJ for an average of price of 2.75. Long NXG average of 2.26. Long PMUat average 1.12.
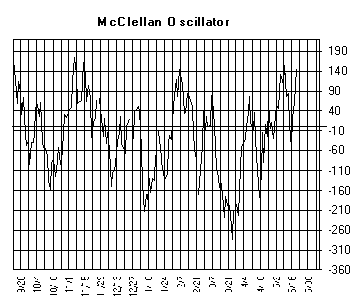
The McClellan Oscillator closed today's at +148 and overbought forthe short term.
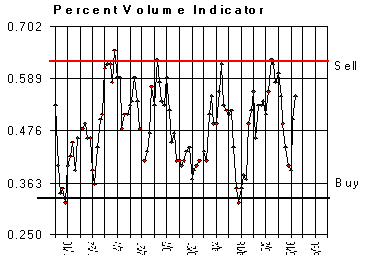
The “Percent Volume” Indicator closed .55 and neural.
The "5 day ARMS" close today at 5.01 and neutral for short term.
Conclusion: Bigger trend on the S&P and Nasdaq appears to be sideways where theprevious highs are resistance and previous low is support.
