Institutional Sentiment & Analysis WeekendReport
for the week of May 16, 2005 - May 20, 2005
Short-Term Sentiment:
Neutral.
Intermediate-Term Sentiment:
Positive.
Intermediate-term Trend:
Positive. Divergent.
Short-term (one-day) Signal:
Neutral. (last signal Strong BUY 5-10).
Ideal Portfolio:
50% QQQQ.
50% SPY.
Results of the Wall Street Sentiment Survey(formerly known as the Fearless Forecaster Sentiment) taken after the close on 5/06/05.
Response was to this question: "At the end of next week will the S & P 500 closeup (bull), down (bear), or unchanged/no opinion (neutral)?"
Weekly BULLS: 50%
Weekly BEARS: 25%
Our `Smart Money' Pollees are as Bullish as they are Bearish and Neutral.
The Senticator is Bullish.
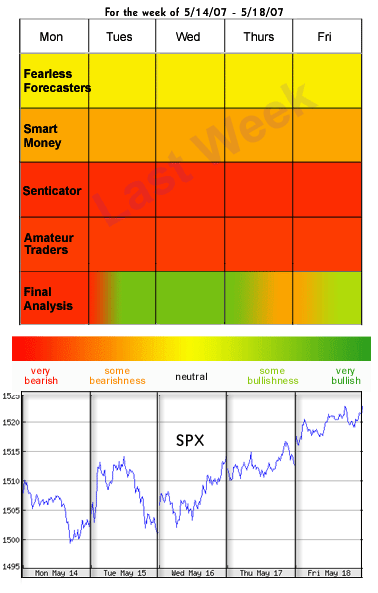
Last time, I said that my call was for generally higher prices, mostly likely up intoTuesday, a pullback Wednesday, a rally on Thursday, and a pullback again on Friday. All inall, I was looking for higher prices, but I expected at least a day or two of correction.Basically, we got the corrective choppiness I was looking for, but only the Nasdaq had thegenerally higher prices on the week. Interestingly, the Nasdaq was basically a day out ofsynch with our forecast. The S&P however was much worse. I think that the best we cando is take a D for correctly calling the chop. Given the oddness of the trading and theschizophrenic nature of the market last week, I don't feel all that bad.
Last Monday, the Mechanical went long at 117.12, as did the Subjective model. Aggressivetraders added to this at 116.75 on margin. All positions stopped out on Friday at 115.00.That was no fun and frankly quite unexpected.
|
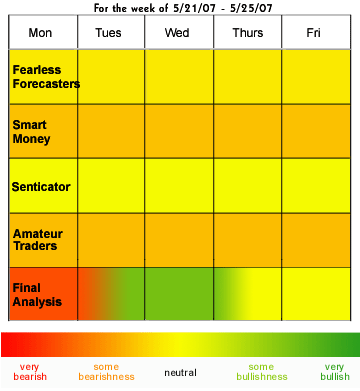
The Fearless Forecasters are rather Bullish with equal Bearish and Neutral readings. The"Smart Money" guys are very split. The Senticator is Bullish. The way the markethas been, it's hard to know what the FF's are trading in and how they are interpreting it.I do know that an even split from the Smart Money implies some likely chop, but the onlything giving us much of a tradable clue is the Senticator, and that says look for higherprices, but from where (and in which market) is the question.
The message board sentiment poll has Bulls at 39% and Bears at 33%. That's leaning a bitBullish, which might support a rally, since these guys are a bad fade. The Actual PositionPoll, however shows 43% at least partially long, and just 29% at least partially shortwith 14.29% of the pollees fully short. That's a lot of longs, and not as many fully shorttraders as I'd like. Then again, the Q's were up more than 1% and that might have a lot ofshorts covering.
The equity P/C ratio fell to 0.72 which is neutral. The Dollar-weighted P/C rose to 1.11,which is in Buy territory. That's a big plus, but this could also be a funny readingsprior to expiration. The OEX P/C ratio was neutral at 0.91. The CBOE P/C ratio 10-daymoving average is lingering near 1 at 0.98, which is still consistent with anintermediate-term Buy.
Last week, AAII reported 30.52% Bulls (vs. 29%) and 36.36% Bears (vs. 45%). This is asolid Bullish shift, but then again, the market is up and the trend has turned. Thereadings are not excessive. Investors Intelligence reported 46.2% Bulls, and 28.0% Bears.The jump back to Bullishness is to be expected. Long-term, this data suggests futureproblems, but near term, it's just not very telling. The data is still basically neutral,but with more rally, we could expect to see excessively Bullish readings consistent with amore important top. LowRisk reported 30% Bulls, up from 22% last week and Bears at 40%,down from 56% last week. This is showing more Bullishness, but still well away from aSell.
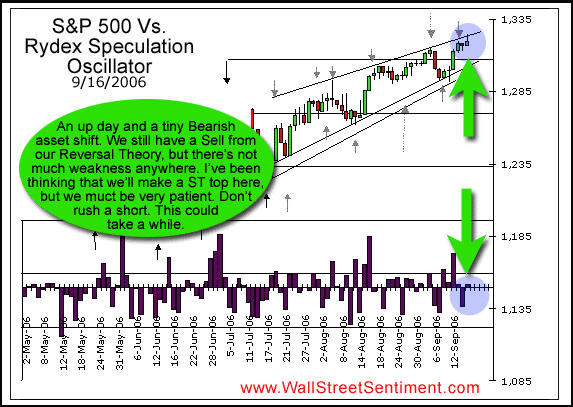
The Rydex Dynamic Bull fund assets increased by $3MM, while the Dynamic Bearish fundassets decreased by $13MM. The shifts somewhat mixed with Bear fund purchases in all ofthe funds save Venture, which makes sense given the overall NDX strength. The RSO showed asmall Bullish shift on a sloppy day, and while that's typically a Sell signal, when yourealize that the entire shift is due to one large Venture to Velocity shift, it's far lesscompelling. I think we can take the data shifts as possibly Bullish, but at worst neutral.
|
The Senticator is Bullish, so again we have look forhigher prices, but things are so odd that it's hard to have much confidence. We are comingout of that killer set up from the $-weighted P/C ratio trading over 1.00 and $1.7 Bil inBearish Rydex shifts, and $-weighted P/C ratio is again over 1.0. The trend turned up, butis looking very iffy on the S&P. Meanwhile, the Nasdaq looks very good. The weeklyMACD turned up, the Cumulative A/D line turned up, and the BPI gave a solid Buy. The NYSEhowever, looks very sick. I don't think that this type of divergence can persist for ever,and I'm concerned that liquidity may be a problem. Then again, this could also be afunction of options expiration week. My not-too-confident guess is for a rally of somesort on Monday and Tuesday for the S&P, then one more sharp sell off and then driftmodestly higher into Friday.
|
The Mechanical model will go long at the open on money on a limit of 116.00, and theSubjective model will go long there as well.
Not everyone likes a short-term trading model, and would like something that hangs onto bigger moves and reflects a less frantic trading pace. If you want to know how I would trade based upon the big picture and the sentiment, the following tracking portfolio is it. Ideal ETF Portfolio (tracking portfolio): |


