ISA Daily Trade Navigator for 6/06/05
Short-Term Sentiment:
Positive.
Intermediate-Term Sentiment:
Negative.
Intermediate-term Trend:
Positive.
Short-term (one-day) Signal:
Neutral. (last signal Weak Buy 6-03).
Ideal Portfolio:
50% QQQQ.
50% SPY. Be alert for a position change. See comments below.
The message board sentiment poll now shows Bulls at 38% and Bears at 35%. That's pretty even, but the small Bullish tilt could imply some buying ahead, since these guys are typically right. The Actual Position Poll now shows 35% at least partially long (well up from Saturday), and a solid 49% (down from 52% on Saturday) at least partially short with 27.03% of the pollees fully short. That's still TON of partially and fully short Bears, and it strikes me as a sign that folks are just a bit to eager to get short and pick a top. Normally, that is a Bullish sign and I think we can view it as such as well.
Following is a recap of the weekend letter:
This week, the Fearless Forecasters are extremely Bearish with a goodly number of Neutral readings. The "Smart Money" guys are very Bearishness too. The Senticator is modestly Bullish, though it's showing signs of acceptance of the rally. The Fearless Forecasters are typically right, but when we see so many on the same side of the boat, we'd better be alert for a quick reversal. That implies some selling on Monday, but there ought to be a rally quick on it's heels.
The equity P/C ratio rose to 0.61 which is neutral and surprisingly so. The Dollar-weighted P/C rose to 0.69, which is in neutral territory. The sub 0.50 reading last week would be enough to generate a Sell IF it was confirmed by both trend and the Rydex data--this could take some time. The OEX P/C ratio fell to 1.12, which is neutral.
Last week, LowRisk reported 47% Bulls and Bears at 29%. This is showing considerably more Bullishness which seems to be proper but also a warning sign. We had readings like this at the December top. Of course, we also had readings like this for weeks going into it, too. AAII reported 49% Bulls and 19% Bears. This is another solid Bullish shift, and now solidly in the danger zone. This can persist for some time, however. Investors Intelligence reported a rise to 47.8% Bulls, and 25% Bears. The move back to Bullishness is to be expected. Long-term, this data suggests future problems, but near term, it's just not very telling.
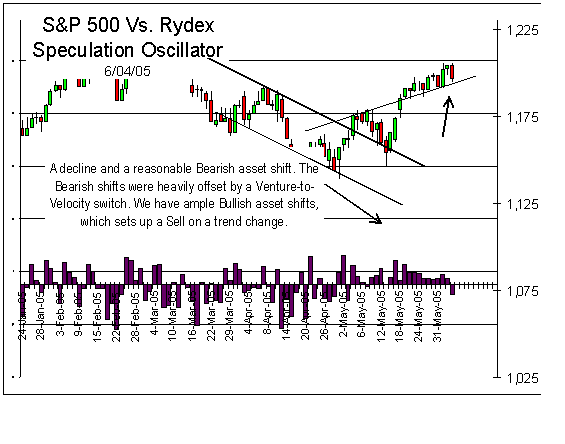
The Rydex Dynamic Bull funds saw $16MM in inflows, while the Dynamic Bear Funds had outflows of $5 MM. More generally the asset flows were rather Bearish with only Bullish shifts in Velocity and Venture. The Rydex Speculation Oscillator showed a modest Bearish shift on a modest down day, which is consistent and doesn't tell us a ton. Longer-term, we have seen some significant aggregate Bullish shifts, which is some cause for concern--but only when the trend turns. So far, things are positive.

The Senticator is flashing a weak Buy so we will be looking long. We are still seeing folks trying to pick the top, which implies that it isn't in yet, despite the fairly serious selling on Friday. There are enough excesses in the market to trade down on Monday, but unless the Bulls come out of the wood-work, I'm of the opinion that they take the market back up again. Bigger picture, I'm thinking that we have a correction ahead and then higher highs for this rally. Near term, however, it's a bit tricky. My read on the sentiment suggests that with the Fearless Forecasters so Bearish, the market is likely to sell down, but reverse. I'm going to call for a decline on Monday, and a low by or before Wednesday, and then a rally into Friday. I'm also quite open to chop on Monday into Wednesday. Longer-term, we have trouble brewing, but it can be costly to be too aggressive trying to call that.
The Mechanical model will go long at the open on a limit of 120.20, and the Subjective model will go long on a limit of 119.15, if we get there.
*****************
Not everyone likes a short-term trading model, and would like something that hangs onto bigger moves and reflects a less frenetic trading pace. If you want to know how I would trade based upon the big picture and the sentiment, the following tracking portfolio is it.
Ideal ETF Portfolio (tracking portfolio):
50% QQQQ @ 35.31, or better.
50% SPY @ 116.65
We will go flat this week if the trend turns, or we may just lighten up. We can afford to hold, and with so many Bears so quickly (one day off the top?), I have to be constructive on the market. On a rally, I'm likely to trim our position by half.
*******************************************************
Past performance is no guarantee of future returns. All information included in this missive is derived from sources we believe to be reliable, but no guarantee can be made to that effect. None of the forgoing should be construed as an offer or solicitation to buy or sell any security. The publisher may have a long or short position in the funds or securities discussed at any given time. We aren't your advisor, unless you have a signed contract with us. Please review any trade that you do with your trusted advisor FIRST.
Note that we are also publishing on our private area on Traders-talk, too, for those who want on-line access to our charts and research. http://www.traders-t...hp?showforum=36 (you'll need to register and sign in on Traders-talk and you'll need an additional password to access the board. If you are a subscriber and you do not have a password, please contact me).
For more on using the ISA and the various sentiment poll data, click here:
www.WallStreetSentiment.com
Mark Young
Editor
1-800-769-6980


