S&P 500 CASH
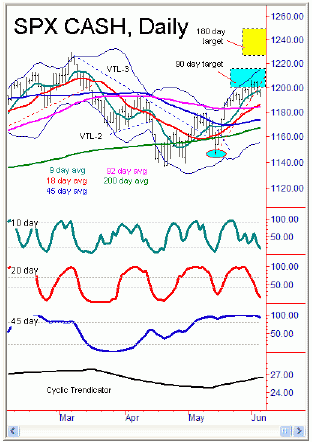
SPX CASH: DailyProjected Support and Resistance levels: High - 1201; Low - 1195
JUNE SP:
SPX CASH:
JUNE SP:
SPX CASH:
SPX CASH:
Current SPX Index Positions:
Mid-term (6-8 weeks) = 80% BULLISH from 1171.13
Short-term (1 day-3 weeks) = 100% BEARISH from 1198.00 (intraday today)
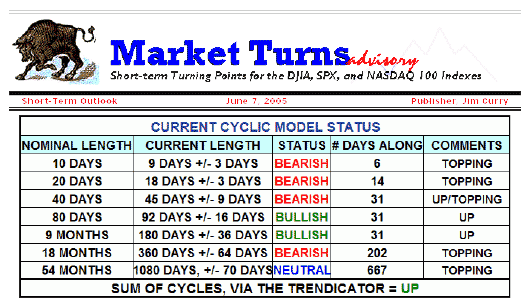
From previous outlook: "Going again to the statistical notesfrom the 20 day cycle may give us an idea of what to expect in the coming sessions if aminor top is in place as is suspected. Since the pattern we should expect to see with thiscomponent is the pattern of a higher low/higher high, we know that the greater majority ofthese have witnessed declinesin the 2.1% range or better off the top and have taken atleast 3-4 trading days before bottoming out, both of which are the best indication that weshould see additional selling into the new week. Taking the 1205.64 swing top andmultiplying by this 2.1% figure would indicate a possible move to the 1180 area on thisindex in the coming days, with the 18 day moving average right now also at the 1184 regionand would also be expected to act as a downside magnet here. With time, 3-4 trading daysoff the top would equate to Monday or Tuesday as the earliest any selling shouldcomplete."

Current analysis: The SPX saw a lower low again on the daily chart,hitting 1192.75 at the session lows before managing an upside reversal into late day toend on a high note. Volume was again on the light side, coming in at less than 1.2 billionshares here, which could end up as at least a slight bullish indication for Tuesday’ssession. As per the notes from last night, the earliest that any drop should be over wouldbe in today’s session, which is 3 trading days from the minor top seen on 6/1/05.However, in terms of price, this market would look better with some test of the low 1180region in the coming days, with the ideal spot for the next minor low to form beingnear June 8, 2005. As well, if this down cycle phase is coming only as the result of the20 day cycle - as is now my suspicion - then the current decline is unlikely to becontinuing on past this Friday, June 10, 2005.
From previous outlook: "Regarding the larger 45 day cycle,that is still an unknown for now - though the 20 day cycle is more certain and is what themain focus should be on here - as even if the 45 day is down the 20 day cycle should bethe one that is responsible for the next good chart low."
Current analysis: The more I look at price and volume action, the morethat I think that the probabilities favor that the spectral analysis noted from last weekin regards to the 45 day cycle will end up as correct. That is, I think that the 45 daycycle did not likely peak at the 1205.64 swing top from last week, and that the currentdownside off the top is coming only as the result of the smaller 20 day cycle. If that istrue, then once this decline completes in the coming days - and at or near the low 1180region as possible - then the market will quickly turn around and make new highs on thenext swing up, and that peak will end up as the peak for the larger 45 daycomponent. To me, the low volume action off the top is the best argument for this rightnow. Stay tuned.
NASDAQ 100 CASH
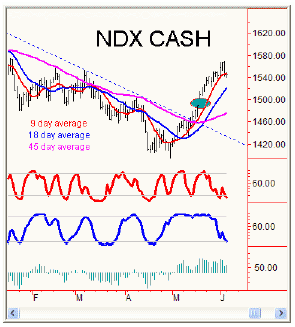
Daily Projected Support and Resistance levels: High,
5-Day Projected Support and Resistancelevels: High, 1557 - Low, 1528
Monthly Projected Support and Resistance levels: High, 1615 - Low, 1479
Current NDX Index Positions:
Mid-Term (6-8 weeks) = 40% BULLISH from 1430.05
Short-term (1 day - 3 weeks) = 150% BEARISH from 1464.76
From previous outlook: "At the lows this index hit 1542.05 andsettled closer to the low-end of the range for the day and the week than the highs, whichnormally should indicate additional weakness is in store for the new trading week. As withthe SPX, volume was on the light side, coming in at only 1.62 billion shares here. If theminor top is in place on this index, then the current decline would target a test of the1517 figure or lower, which is a 3.2% drop off the 1568 swing top and is the area that thegreater majority of bullishly translated 20 day down cycles have moved to. And, as withthe notes from the 45 day cycle on this SPX, there is at least the potential that a largerdecline could be in progress here in the coming days. With time, ideally we should seelower lows into Tuesday or Wednesday of the new trading week."

Current analysis: As with the SPX, the NDX also made new lows on thedaily chart, but then also reversed here to end the day basically unchanged. Volume waslight at only 1.4 billion shares traded, which can be at least a minor bullish indicationgoing into Tuesday’s trading session. As per the recent notes here, if a minor top isin place with the 20 day cycle on this index then the odds will favor a test of the 1517area or lower in the coming days, with the next minor low ideally being in place byFriday’s session at latest - and could be in by as early as Wednesday of the currentweek. Resistance to any move higher is the 1557-1568 region, with the higher numberneeding to hold on a closing basis in the coming days to keep this minor downtrend off thetop in play. Both of the 10 and 20 day oscillators are in normal oversold region here,which to me indicates that there is not likely a ton of time left on this down cycle offthe top, though ideally we will see the McClellan oscillator moving to or slightly belowthe zero line as this cycle bottoms out. In other words, look for resistance to hold theupside here and for the low 1500’s to act as a downside magnet in the comingsessions, but a low in place by late week on both indexes - even if the normal percentagecorrection off the top only materializes into more of a sideways affair in the comingdays. Other than the above there is not a ton to add here tonight and so we will see howTuesday’s session plays out and then take another look tomorrow night.
Jim Curry
Market Turns Advisory
Email: jcurry@cycle-wave.com
Disclaimer - The financial markets are risky. Investing is risky. Pastperformance does not guarantee future performance. The foregoing has been prepared solelyfor informational purposes and is not a solicitation, or an offer to buy or sell anysecurity. Opinions are based on historical research and data believed reliable, but thereis no guarantee that future results will be profitable. The methods used to form opinionsare highly probable and as you follow them for some time you can gain confidence in them.The market can and will do the unexpected, use the sell stops provided to assist in riskavoidance. Not responsible for errors or omissions. Copyright 2005, Jim Curry.


