
For 30 to 90 days horizon: Flat the S&P and Nasdaq for the moment.
For monitoring purposes: Long XAU, 87.96 on 4/21/04.
Longer Term Trend monitoring purposes: flat.
What to expect now:
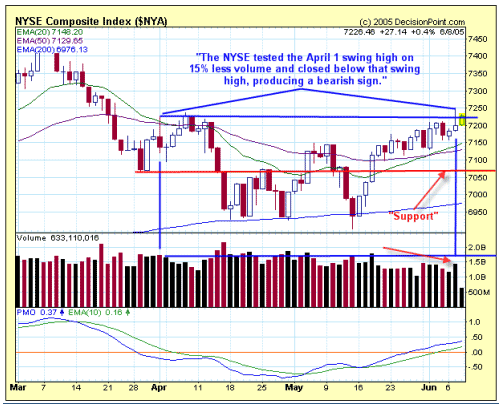
On the last page of this report, we have displayed the graph of the NYSE(courtesy of www.decisionpoint.com). What we wanted to point out here is thatyesterday this market test the previous important swing high of April 1 on 15% less volumeand than closed below the April first high. This condition is called an"Upthrust" and a short term bearish sign. Also notice that on the rallyfor the last several weeks that (in general) the volume has decline, which shows energy tothe upside is decreasing. To sustain a rally, the volume should be generallyincreasing. Therefore there are some things wrong with the current rally. However, we like to trade in the direction of the NYSE Summation index and right now thisindex is trending up so we will not look for a short position here. But rather we willwait for a pull back and look to go long (providing volume is light on the pullback). If a pull back does materialize here, support is still near the 1175 area onthe S&P. Mr Greenspan talks tomorrow and may trigger the short term turn in themarket.
Nasdaq Composite:
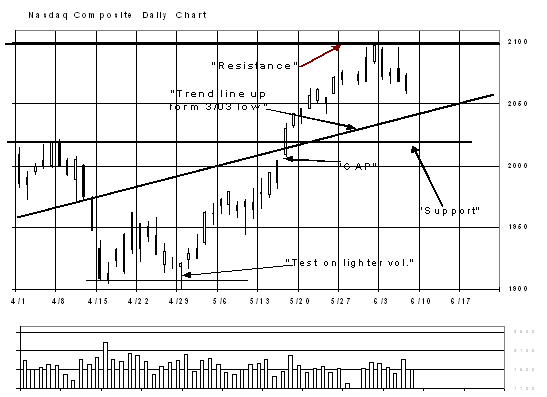
On Monday's report, we said, "Last Wednesday (June 1), we sent a graph of the Nasdaqdating back to November 2004. What we wanted shown on this graph is that the Nasdaqmay be drawing a "Head and Shoulders Bottom" where the April low was the"Head" and the February and March time frame represented the "LeftShoulder". Usually the "Right Shoulder" is similar in time and priceas the "Left Shoulder". The "Left Shoulder" took about twomonths to complete. If that holds true for the potential "Right Shoulder"than the Nasdaq may develop a trading range for the next two months. Support comesin near the 2015 range and resistance comes in near the 2100 level and these tradingboundaries may represent the "Right Shoulder". However, it's to soonto know if this trading range will indeed develop. The Summer period is in generalthe dull period of the year and a trading range here would make since. For near termwe would like to see the Nasdaq test the February 15 high at the 2103.45 level on lightervolume. This condition would setup for a pull back to support near the 2015 range.If the 2015 range is tested on lighter volume a potential buy signal could gettriggered. We are only playing the long side now because the Nasdaq Summation indexis trending up." Nothing has changed since Monday and we are still looking forthis setup to materialize.
GOLD Market:
Short term trade, Long BGO (4/19/05) at2.37. This trade is separate from our long-term position in BGO. We bought EGO (goldIssue) at 2.23 (5/26/05). We bought PMU (5/27/05) at .50 and bring our average price to.81.
BGO has short term support at 2.05, nextupside significant resistance is 3.20 range. The 3.20 area may produce aconsolidation that may last 6 weeks. We still have our long term target to 9.00 onBGO. CBJ has short term support at 1.88. Next upside target is 2.70, whichalso may produce a consolidation that may last several weeks. Longer-term target onCBJ is still 8.00 to 10.00. EGO has short term support at 2.22. Next shortterm upside target is 3.00. Bigger time frames suggest EGO should go to 6.50. PMU has support at .50 with the next upside target to .80. Bigger picture suggestsPMU could go to 3.50. NXG has short term support at 1.10. Next upsideresistance is 1.35. If NXG gets through 1.35, than next upside target is 2.60. If 2.80 is exceeded on NXG than stock should go to 8.00.
We double our positions in BGO on (7/30/04) at 2.34 and we now have an average price at2.70. Long CBJ for an average of price of 2.75. Long NXG average of 2.26. We bought PMU(5/27/05) at .50 and bring our average price to .81.


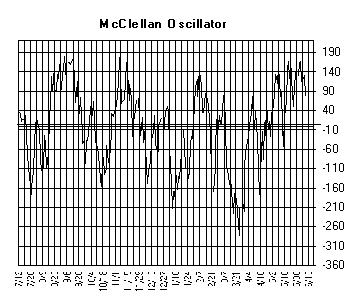
The McClellan Oscillator closed today'sat +91 and overbought for the short term.
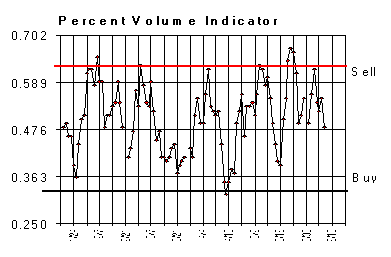
The “Percent Volume” Indicator closed .48 and in neutral territory.
The "5 day ARMS" close today at 5.83 and in neutral territory.
Conclusion: Bigger trend on the S&P and Nasdaq appears to be sideways where theprevious highs are resistance and previous low is support.
Longer Term Trend monitoring purposes:


