Capital Market Commentary
THE WORLD CAPITAL MARKETS ARE AWASH IN A ‘SEA OF GREEN’:
All of the major asset classes are showing gains this morning; stocks in both Asia and Europe are showing gains – with the lone exception being Japan’s modest -0.1% loss. German, France et all are all sharply higher – up on average by +0.7%. Bond prices too are higher; yields are lower as the 10-yr note is lower by 3 bps to 4.07%. And gold and base metal prices too are higher; gold up by +$1.80, while the base metals are higher by +0.5% to +1.0%. It would appear the ‘reflation trade’ is currying favor once again, but we are at a loss as to why it may be doing so. We have noticed lately that the monetary base may be breaking out of a consolidation pattern…which would prompt stronger economic activity sometime towards the end of 2006. But it is far to early to say with any certainty that this will indeed materialize.
TROPICAL STORM CINDY…NOW TROPICAL STORM DENNIS ARE ROILING THE ENERGY MARKETS:
West Texas Intermediate (WTI) crude oil is pushing higher above the $60/barrel level for August delivery Cindy has to shut down operation throughout the Gulf of Mexico’s in terms of tankers off loading product as well as refiners battening down the hatches. However, the real concern is that TS Dennis is expected to pick up hurricane strength today, and move into the Gulf in three days or on Friday. If Dennis is anything like Hurricane Ivan – then platform damage and lower crude production will materialize – sending crude oil prices far higher than is reasonable.
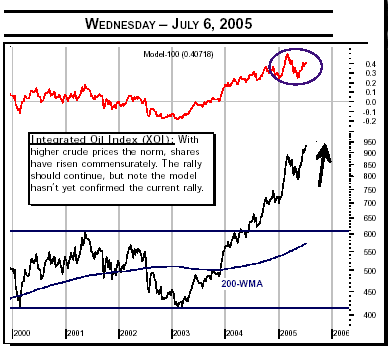
We will continue to make the point that near-term prices are the media’s focus; longer-term prices are what we should focus upon and they are high…and they are rising sharply. While we talk of $60/barrel crude for August delivery – we see crude for January-2006 delivery at $63/barrel, June-2006 delivery at $62/barrel, and December-2006 delivery at $60/ barrel. We think our point is clear; high demand and a ‘bottleneck’ of refining capacity renders supply concerns to the back bench…there is plenty of supply, but the market has focused upon increasing demand. Now, it will focus upon increasing demand and lack of supplies…a very bullish combination indeed. How high is high…we don’t know…but higher is all we need to know to trade the oil patch successfully.
TODAY’S ECONOMIC REPORTS:
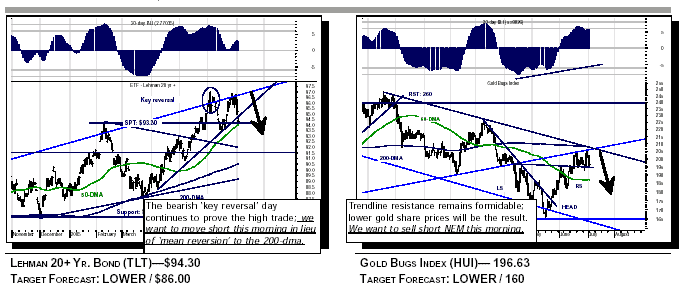
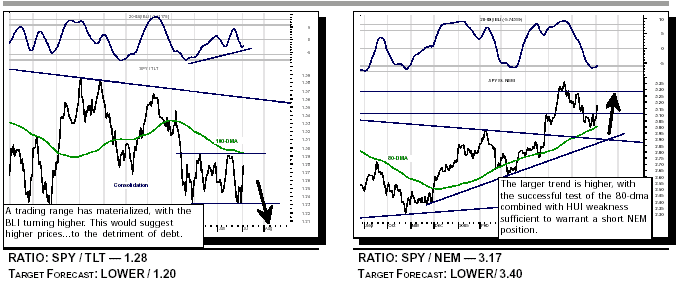
The June ISM Services index is expected to print 58.0, which is down from May’s 58.5 – we would expect something a bit strong above 59.0. However, this minutia matters very little, for all we should concern ourselves with here is that it is above the 50.0 level…meaning expansion. What number it is means nothing – the market may care, but the fact of the matter is that services remain strong, they may get stronger. This report will indeed affect our new recommendation this morning to be short of TLT or bond prices; be prepared.
Also of interest will be St. Louis Fed President Poole (non-voting FOMC member) participating in a panel discussion titled “After Greenspan: Wither Fed Policy?” at the Western Economic Association International annual conference in San Francisco, CA.
Portfolios: Technical Summary of ETF Portfolio & "Paid-to-Play" Portfolio
[Reserved for Subscribers]
The Rhodes Report Portfolio Update
[Reserved for Subscribers]
ETF Chart Comments
OUTLOOK: We remain long-term fundamentally and technically bearish, with the short-term picture becoming rather ‘neutral’. We were stopped out of 1/2 of our short position yesterday, and are quite nervous for the other 1/2.
GENERAL TRADING COMMENTS:
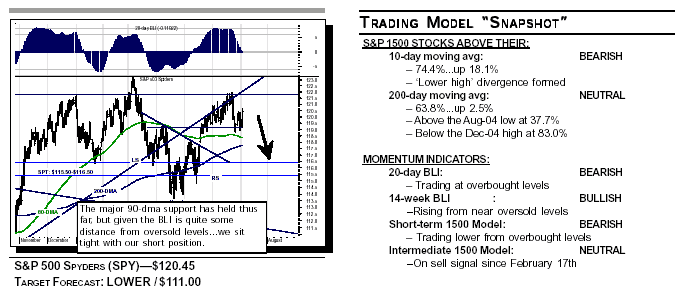
Once again, prices successfully tested major S&P 500 support between 1189-1192; with yesterday’s sharp rally sufficient to relieve the short-term oversold condition, but not sufficient to become overbought.
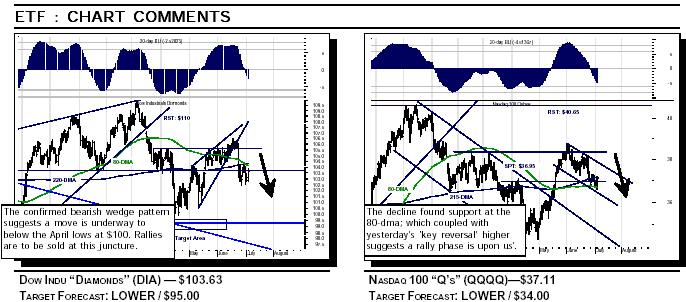
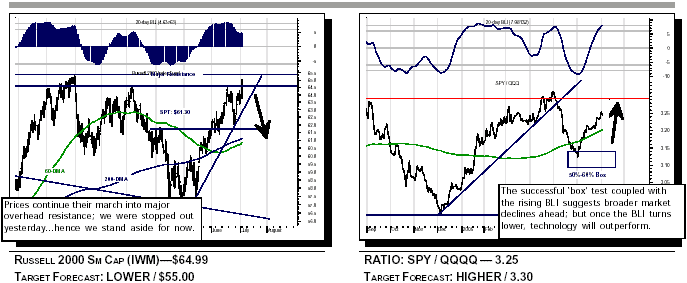
We suspect the 1189-1192 zone will be tested again rather soon; we further suspect each and every attempt to break below it will be met with less and less buying enthusiasm that will result in it ultimately being broken. However, we are not willing to add to our current short position after being stopped out yesterday in IWM; but once the ‘line in the sand’ is violated...then this would be the proper point to do so. Technically speaking, our important short-term indicators – the 20-day BLI and Short-term Model – are trending lower and still quite some distance from traditional oversold levels. This simply suggests further downside action is required to relieve the recent overt overbought condition where the trade is clearly positioned as ‘still bullish’ if one looks at the nearly non-existent small cap decline. Moreover, our intermediate term 40-day BLI has now turned lower from overbought levels, which now requires we consider a test of the major 275- day moving average at 1157.
Further troubling is the fact QQQQ formed a bullish ‘key reversal’ yesterday at major support; this should lead to further buying which indeed if it materializes would turn our ratios bullish QQQQ as well.
