ISA Daily Trade Navigator for 7/12/05
Short-Term Sentiment:
Modestly Negative.
Intermediate-Term Sentiment:
Mildly Negative.
Intermediate-term Trend:
Positive.
Short-term (one-day) Signal:
Weak Sell. (last signal weak Buy as of 7/7).
Ideal Portfolio:
100% Money Market. Looking to Buy a pullback.
The message board sentiment poll has Bulls at 31% and Bears at 38%, which is much more normal and a little bit Bearish as these guys tend to be right. In this case, especially so after the excessive readings yesterday. The Actual Position Poll shows 45% at least partially long, and 34% at least partially short. There are 10.34% fully short Bears. My danger zone is 10% fully short. We're there. Watch out for a correction. It will probably be quickly reversed, depending upon how this sentiment is corrected.
Per the Short-term Signal above, if you're going to trade it, I'd use the futures and be rather nimble--perhaps short the gap up and use a 5 point target or moving stop. I don't think we have more than about 10 points downside here, max. Don't hold short overnight.
The equity P/C ratio rose to 0.50 which is both surprising and less Bearish for the market. The OEX PC ratio fell to 1.22, which is solidly neutral. The $-weighted P/C rose to 0.53, which is just out of the Sell zone. We've had enough to set up a intermediate-term down trend when we get confirmation from breadth, the trend and the Rydex numbers--we're a long way away from that. The CBOE 10-day P/C ratio fell to 0.88 and implies that we probably have higher highs coming.
Last week, AAII reported 43% (down from 45.89%) Bulls and 20% (down from 29.45%) Bears. This remains at solidly Bullish levels, consistent with tops, but in our experience greater levels of Bullishness that last for much longer are reasonably likely before we get a real top. Again, this is only a yellow light telling us to be alert to a possible top when trend and breadth both negative. Also remember that most of the really solid declines come from more benign readings after high levels of Bullishness. LowRisk reported 24% (same as last week) Bulls and Bears at 52% (down from 59%). That's still a lot of Bears and a positive for the market. Investors Intelligence reported a fall to 53.9% (vs. 55.1%) Bulls, and 21.4% (vs. 19.1%) Bears. This modest Bearish shift is reasonable. This is consistent with a building Top, though such is probably weeks off.
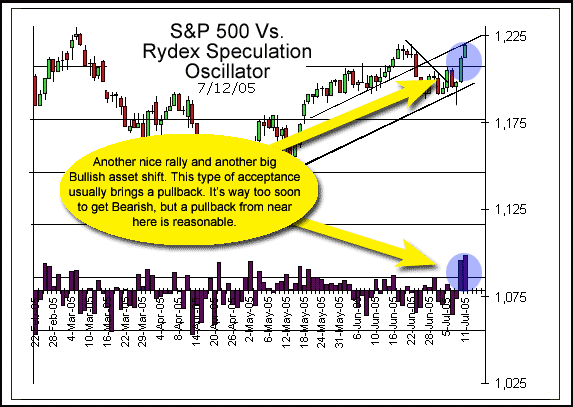
The Rydex Dynamic Bull funds saw $67MM of inflows, while the Dynamic Bear Funds had outflows of $29MM. Generally, the fund shifts were again quite Bullish, with only the non-Dynamic S&P Bull fund showing a modest Bearish shift. The Rydex Speculation Oscillator showed a big Bullish shift on another solid rally. This is the type of acceptance suggests a short-term pullback. We still have a long way to go before setting up a top--though at the current rate, it won't be THAT long.

The Senticator is Bullish and so is the trend. The message board position poll has pollees heavily Bullish with fully short Bears down in the danger zone. The Rydex data shows real acceptance of the rally, the like of which we've not seen in some time. In the past, two big days with large Bullish shifts has typically brought at least a couple days of chop, if not a hard decline. I think we can look for a a 1% +/- pullback shortly. Because the trend is up, and the Senticator is Bullish, we have to view any decline as a buy. If you short, don't stay that way too long. The odds favor higher prices from here after a pause.
The Mechanical Model went long at 121.33, and the Subjective model is looking to join it on a limit of 121.02.
*****************
Not everyone likes a short-term trading model, and would like something that hangs onto bigger moves and reflects a less frenetic trading pace. If you want to know how I would trade based upon the big picture and the sentiment, the following tracking portfolio is it.
Ideal ETF Portfolio (tracking portfolio):
100% Money Market
The weekly MACD turned back up and the 21-day and Daily MACD have joined it. We're overbought, so a pullback is reasonable. If we get it, we're going to be buying. Watch the Q's as your instrument of choice in here. We'll send out a memo, but you can buy a 1% pullback in the S&P if you don't hear from us.
*******************************************************
Past performance is no guarantee of future returns. All information included in this missive is derived from sources we believe to be reliable, but no guarantee can be made to that effect. None of the forgoing should be construed as an offer or solicitation to buy or sell any security. The publisher may have a long or short position in the funds or securities discussed at any given time. We aren't your advisor, unless you have a signed contract with us. Please review any trade that you do with your trusted financial advisor FIRST.
For more on using the ISA and the various sentiment poll data, click here:
http://www.WallStreetSentiment.com
Mark Young
Editor
1-800-769-6980


