S&P 500 CASH
SPX CASH: DailyProjected Support and Resistance levels: High - 1231; Low - 1219
SEPT SP:
SEPT SP: 5-Day Projected Support andResistance levels: High - 1230; Low - 1210
SPX CASH: Monthly Projected Support andResistance levels: High - 1270; Low - 1208
SPX CASH: Yearly Projected Support andResistance levels: High - 1292; Low - 1135
Current SPX Index Positions:
Mid-term (6-8 weeks) = 25% BEARISH from 1240.02
Short-term (1 day-3 weeks) = NEUTRAL
From previous outlook: "With the above said, the 10 day cycleis viewed as higher, providing the 1215.93 swing low from Thursday holds the downsideaction early this week. But, even if I am incorrect here and the 1215 swing low were to betaken out before the normal 1.2% bounce off the low is seen, then - at least in terms oftime - we would probably still be closer to a bounce low than a high. Why? Because thelongest that a 10 day cycle down phase has lasted while in the current configuration was 8days off the top. And, if 1215.93 were to be taken out south Monday that would be 7 daysoff the last confirmed 10 day peak - and thus the probabilities would still favor we werenearing a short-term low for at least a quick bounce higher."

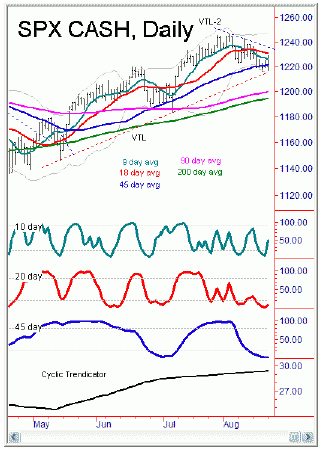
Current analysis: The SPX got the anticipated rally into resistance,opening gap higher with the futures to a quick tag of 1228.96 on an early-day price rally.Early-day and early-week rallies into resistance tend to be bearish affairs, andtoday’s run up into the weekly projected resistance high was no exception. The indexpromptly reversed off resistance to hit 1216.47 at the intraday low - before rebounding toactually end slightly higher on the day. Volume was muted, coming in at 1.2 billionshares, which is exactly the same as Friday’s closing levels and thus offers noinformation for the short-term. As per the notes from the prior outlook, with Fridayholding a daily low and taking out a daily high the probabilities favored that the 10 daycycle up phases was in progress, further confirmed both by today’s price action - andalso by the fact that the 10 day oscillator turned up at today’s close.

From last night: "A 1.2% or better bounce off the lows, if itwere to materialize, would target some test of the 1229 region - which also happens to benear current resistance at the new weekly projected high of 1228. In other words, if abounce to this 1228-1229 region were seen, then I would also be on the lookout for theindex to find resistance at or near this same area."
Update to the above: As perabove, the minimum rally with the 10 day cycle while in the current pattern has been about1.2% off the bottom - while the greater majority have actually seen rallies of 1.4% orbetter. Taking the 1215.93 swing low from last Thursday and multiplying 1.2% equals1230.52 SPX CASH. Today’s rally to the 1228.96 on the SPX then actually falls shortof this level, which may offer some telling information here. In other words, if paststatistics are any guide, then the high for the week may not yet be in place here and atest of the 1230 region may still be out there, ideally being seen between now andThursday‘s close. Why? Because the greater majority of the 10 day up phases while inthe current configuration have seen their peaks made on or before 5 days from their priorlow.
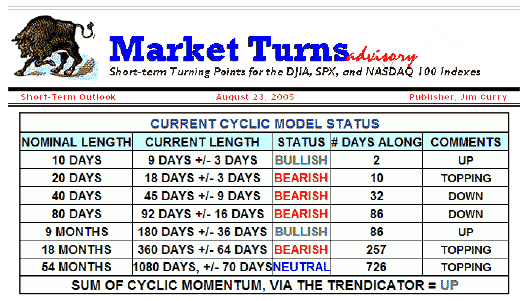
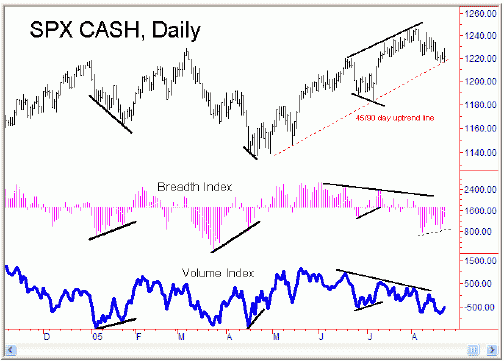
Note that the above analysis actually contradicts some of the informationfrom the numerical projection (which is projecting a low near August 24) and the Bradley(August 30th). In other words, with thediscrepancies with the above anything is possible here - but my hunch is that we are goingto see a move back above today’s intraday high at some point this week - if not intomorrow’s session. In looking at the breadth index again above, the divergence(noted last night) is what to me indicated a potential rally early this week and a test ofweekly resistance. However, having noted that I should add here that when this indexregisters a divergent low it will ‘normally’ try and rally back to or above thezero line in the following days. On the chart above you can see that is moving towards thezero level right now, but looks like it would need another 1-4 days before actuallygetting back to it. And, if this is seen, then prices are likely to be working at leastslightly higher as this is occurring. Otherwise, with the slight discrepancy between whatthe 10 day cycle and short-term breadth are suggesting - and the notes from some of thebigger cycles suggesting a possible low being made between August 24-30
NASDAQ 100 CASH
Daily Projected Support andResistance levels: High - 1582; Low - 1559
-Day Projected Support and Resistance levels:High - 1590; Low - 1556
Monthly Projected Support and Resistance levels: High - 1680; Low - 1545
Current NDX Index Positions:
Mid-Term (4-8 weeks) = NEUTRAL
Short-term (1 day - 3 weeks) = NEUTRAL
From previous outlook: "Since this index closed near the lowsin Friday’s session, this will usually invite additional weakness into the followingsession. As well, taking out Friday’s ‘inside day’ low to the downside(1573) - if seen in Monday’s session - would likely invite some additional weaknesstowards the 45 day moving average, currently near the 1565 region."

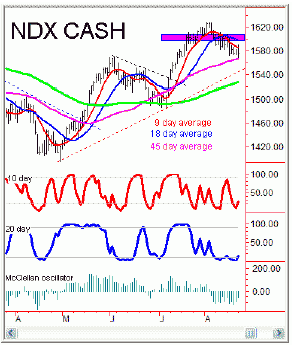
Current analysis: As per the notes from the prior outlook, if the 1573swing low were taken out south then the odds would favor a test of the 1565 region. Aswith the SPX, the NDX actually first opened higher - hitting an intraday high of 1588.92here (just below the weekly projected resistance high of 1590) before giving way toselling and taking out Friday’s 1573 swing low - hitting exactly 1565.81 at theintraday bottom before reversing off that level to end the day slightly to the upside.Volume came in near the 1.4 billion share range, and, coming on a day where both a higherhigh and a lower low were seen on the daily chart it basically suggests that bothtoday’s intraday low and high will be seen again at some point in the coming days.
From 8/17/05 daily outlook: "Going back to the 20 dayoscillator on the NDX, the same pattern that was seen last week once again occurred hereat today’s close on this index. Again, what I have found is that about 90% of thetime that the 20 day oscillator moved below it’s lower reference line - while at thesame time the daily Trendicator (from the SPX chart) is still pointing up - that the oddsfavor that price will be back above that daily NDX close when the 20 day oscillator risesback out of oversold territory. With that, today’s close was 1574.28, and so itshould be interesting to see if the pattern works once again in the coming days."
Update to the above: On our daily chart you can see that the 20 dayoscillator moved back out of oversold region at today’s close. As per my notes onthis, when the Trendicator is pointing higher and the 20 day oscillator moves below it’slower reference line then the odds are about 90% that prices will be back above thatday’s close when the oscillator moves back above this line. This basically forecastthat prices would be above the 1574.28 area when this pattern was finished; today’sclose was 1575.59, which thus once again satisfies this setup. Short-term, if theprobabilities favor that the SPX is going to make another try or move back abovetoday’s intraday high at some point, then the same notes should be applicable for theNDX as well. In other words, though another try at the 1565 low can still be seen in thenext day or two (as per the notes from volume), the odds will favor that the NDX willstill make another try at the 1590-1600 ‘swing resistance’ bar on the dailychart. Stay tuned as we see how this plays out in the next few days.
Jim Curry
Market Turns Advisory
Email: jcurry@cycle-wave.com
Disclaimer - The financial markets are risky. Investing is risky. Pastperformance does not guarantee future performance. The foregoing has been prepared solelyfor informational purposes and is not a solicitation, or an offer to buy or sell anysecurity. Opinions are based on historical research and data believed reliable, but thereis no guarantee that future results will be profitable. The methods used to form opinionsare highly probable and as you follow them for some time you can gain confidence in them.The market can and will do the unexpected, use the sell stops provided to assist in riskavoidance. Not responsible for errors or omissions. Copyright 2005, Jim Curry.


