ISA Daily Trade Navigator for 8/24/05
Short-Term Sentiment:
Negative.
Intermediate-Term Sentiment:
Neutral-to-positive.
Intermediate-term Trend:
Negative-Confirmed.
Short-term (one-day) Signal:
Neutral (a bit late to Sell). (last signal "Buy, but don't get greedy" 8-19.).
Ideal Portfolio:
100% Money Market. Looking to Buy a better sentiment or a turn.
The message board sentiment poll has Bulls at 39% and Bears at 39%. A dead even split. In this past, this has been Bearish. Don't ask me why, it's just an observation we've made over the past couple years. The Actual Position Poll shows 44% at least partially long, and 44% at least partially short, too. A dead even split again. There are now 14.44% fully short. This is interesting. We don't have a ton of experience with this type of reading in the message board position polls, but in the surveys, it typically implies a turn coming soon. We probably need some more excessive readings first, though. The sub-20% Fully short Bears isn't Bullish.
The equity P/C ratio rose to 0.60 which is neutral and not much help to the market. I still want higher readings here. The OEX PC ratio rose to 1.74, which is negative, since these guys are a bad fade. Actually, a high OEX P/C ratio is one of the more reliable ST Sells we know of. The $-weighted P/C rose to 0.87, which is better, but we've still not seen anything that we could construe as a buy (north of 1.0). The CBOE 10-day P/C ratio sits at 0.97 which is still closer to a Buy than a Sell and implies that a really good top is a long way off, and also that we could see a nice rally soon. Despite the other Bullish data, the low equity PC ratio and the OEX data suggest lower prices.
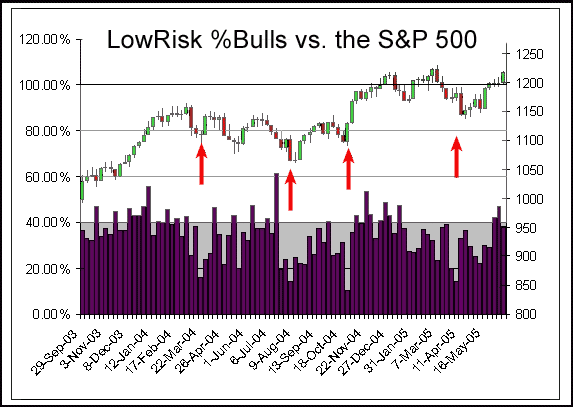
LowRisk reported 12% (down from 33%) Bulls and Bears at 61% (up from 46%). This solidly in Buy territory. During the wrong time of year, the rally can come a week later, or be more modest, but we are definitely on Buy look out. See chart below. Last week, AAII reported 29.29% (down from 40%) Bulls and 40.40% (up from 30%) Bears. This is much better and more constructive. Remember, often the market can fall hard out of relatively benign readings after a string of really Bullish ones. These readings suggest that the Bull is not over, but that we could have more near-term weakness. Investors Intelligence reported a drop to 57.3% (vs. 59.1%) Bulls, and a rise to 22.5% (vs. 19.3%) Bears. This is about what you'd expect.

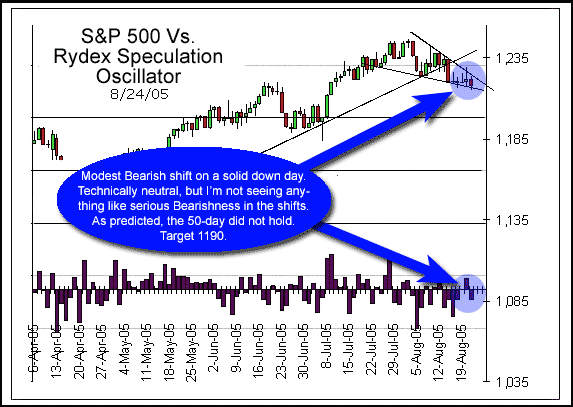
The Rydex Dynamic Bull funds saw $20MM of outflows, while the Dynamic Bear Funds had inflows of $6MM. The non-Dynamic fund shifts were Bearish, but not excessive. The Rydex Speculation Oscillator showed a modest-to-decent Bearish shift on a solidly lower day. That's in line, though I'd have expected a bit more Bearishness given the break of the 50-day. Longer-term, we've seen some pretty serious Bearish shifts over the past couple of weeks, and we've almost wiped out all of the Bullish shifts from the April low. We've also not seen anything like what is necessary for an important top, either. We have to be on the lookout for a low--but not yet.

The Senticator is Bullish, so again, long is theoretically the way to look. The big issue here is that we need to deal with the Sell from the Weekly MACD and the Cumulative A/D volume. That's not to be ignored, and it implies lower prices over the next week or three. On the flip side, Low Risk is suggesting a rally of some magnitude is coming (see chart above), and the 10-day CBOE P/C ratio and the Rydex Data agree. The problem is that we just don't have the set up from the equity and the $-weighted P/C ratios. Until we get it, we need to be very careful. I'd not pick a bottom yet.
The Mechanical model took a 50% long at 122.58. Double up at 120.90. The Subjective model will initiate 1/2 on a limit of 121..05 and add on weakness. This is just speculation that the Senticator will bring us a bounce by Friday.
*****************
Ideal ETF Portfolio (tracking portfolio):
100% Money Market
With the deterioration in the Cumulative A/D volume, we're less inclined to buy this pullback. The pessimism is rising, however, so we may well begin probing long regardless, but only if we get real pessimism showing in the options data. It's not there yet.
*******************************************************
Past performance is no guarantee of future returns. All information included in this missive is derived from sources we believe to be reliable, but no guarantee can be made to that effect. None of the forgoing should be construed as an offer or solicitation to buy or sell any security. The publisher may have a long or short position in the funds or securities discussed at any given time. We aren't your advisor, unless you have a signed contract with us. Please review any trade that you do with your trusted advisor FIRST.
For more on using the ISA and the various sentiment poll data, click here:
www.WallStreetSentiment.com
Mark Young
Editor
1-800-769-6980


