Analysis of the major stock indices, sectors, industry groups, gold, commodities, bondsand more. Plus a model portfolio for stocks.
Editor: Arthur Hill
arthurh@tdtrader.com
www.tdtrader.com
Great Expectations: This is just a heads up to inform you that my wife is 39+weeks pregnant and due 6-September. The baby could come any day now and I will be "oncall" until then. Depending on the timing and labor, this may result in one or twoday delay in the TDT Report. Stay tuned….
Market Overview: Something is rotten in the kingdom of Denmark. Put another way,retail stocks are stinking up the Consumer Discretionary sector and by extension theoverall market. The Retail HOLDRS (RTH) stalled at the end of July and then declinedsharply over the last five weeks. This started well before Katrina and the sharpness ofthe decline is not typical for a correction. Of course, neither was the Mar-Apr declineand RTH reversed on a dime. This decline has yet to reverse and should be considerednegative for retail, consumer spending, the economy and the overall market. Perhaps highoil prices are finally starting to bite.

Even though the major indices have yet to break down, relative weakness in the RetailGroup and Consumer Discretionary is disconcerting. The wrong sectors are leading and theright sector is lagging (see sector analysis below for details). In addition, I am seeingrelative weakness in the Dow and S&P 100. Conversely, Technology is holding up welland I am watching the Software HOLDRS (SWH) and Semiconductor HOLDRS (SMH) for potentialbreakouts that could lift the market. Either the Consumer Discretionary sector joins theTechnology sector and stocks rise or the Technology sector joins the ConsumerDiscretionary sector and stocks fall. A split in these two sectors would mean a flatmarket (S&P 500).
As detailed in the charts below, we are at an important juncture. A number of indices,sector ETFs and industry group ETFs are trading at potential bullish reversal points. TheAugust correction may have run its course, but we now need a bullish catalyst to solidifya reversal. Failure to reverse at these levels and further weakness would turn thesecorrections into trend changing events. I have no particular fear of September andOctober, but would not want to own stocks after trend changing event.
Speaking of danger, I’m sure we will be seeing this quote a lot in the comingmonths:
"October. This is one of the particularly dangerous months to invest in stocks.Other dangerous months are July, January, September, April, November, May, March, June,December, August, and February." – Mark Twain.
Cycles and historical precedents are great when they work. The problem is theydon’t always work. Most recently, the 6-month cycle (buy in November and go away inMay) is not working. Cycles and historical precedents are important when confirmed withprice action. It’s the charts, stupid. If the cycle or historical precedent is goingto work, the charts will give us the heads up and there will most likely be a signal.Rarely do the markets move without some sort of signal or warning.
Position Summary
-Nasdaq Composite: Bullish with support at 2039
-S&P 500: Bullish with support at 1188
-TBond ETF (TLT): Bullish with support at 93
-US Dollar Index: Bearish with resistance at 89
-GLD: Bullish with support at 42.7 / 430
-XAU: Bullish with support at 93
-Oil: Bullish with support at 55
Have a great weekend! -Arthur Hill Next: Full Report on Friday 9-Sep
***Major Indices***
Dow Diamonds ETF (DIA): The noose is tightening as DIA forms alarge triangle that extends back to March. The stock firmed at the lower trendline overthe last few days and further weakness below 103.4 would be most negative. This wouldbreak the triangle consolidation and project much lower prices.
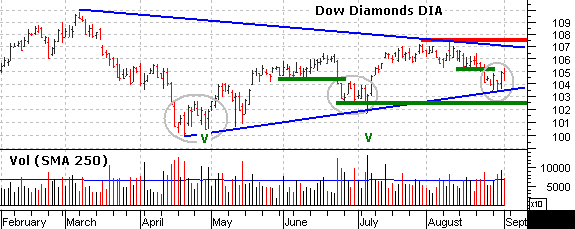
The gray ovals show prior consolidations that ended with bullish reversals (grayovals). Each reversal broke the consolidation high with expanding volume (green carets).There was a surge on Wednesday with good volume, but no follow through just yet. A moveabove 105.75 would be short-term bullish and keep the triangle in play.
Nasdaq 100 ETF (QQQQ): QQQQ is also at an important juncture.After declining the month of August, the stock found support around 38 and bounced thisweek. A bullish engulfing formed on Monday and the stock is challenging the flagtrendline. This week’s surge is not as strong as that seen in early July and furtherstrength above 39.2 is required to confirm the falling flag (Nasdaq: 2160 and Nasdaq 100:1590).
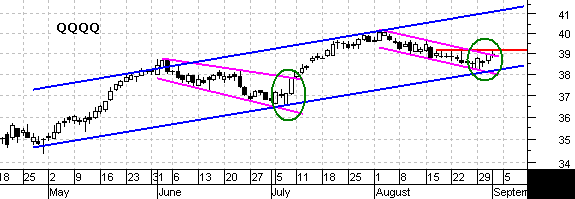
I should also point out that a classic bullish setup is in the works. The stockretraced 50% of the July advance, returned to broken resistance from the mid June highsand formed a falling flag. This is a classic correction and now we need a catalyst toignite the bulls.
S&P 500 ETF (SPY): SPY bounced off a support zone around 1200, butthis may be just an oversold bounce similar to late March and early April (gray oval).After a new high in early March, there was a sharp decline and then a consolidation(rising flag). Similarly, the index recorded a new high in August and promptly declined.We could be in phase like late March when the stock began consolidation before acontinuation lower.
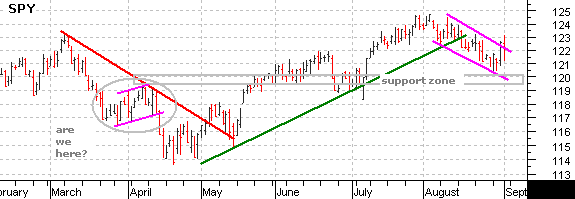
What are the signs of weakness? The stock fell back immediately after makingconsolidation highs in late March and early April. Strong stocks don’t fall back,they continue higher. If we see the stock moving higher and then immediately falling back,it will be a sure sign of selling pressure and increase the odds of a failure.
S&P 400 Midcap ETF (MDY): Should the major indices breakoutand move higher, who will lead? We may as well go with the past winners: small andmid-caps. These are the high-beta stocks that move more than the large-caps (lower betastocks). They will move higher and faster in an uptrend as well as lower and faster in adowntrend. Either way, grab your hat!
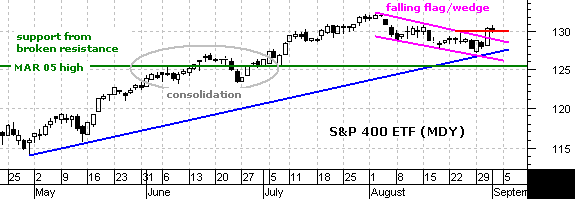
MDY formed a falling flag/wedge and broke resistance with a big move on Wednesday.However, a doji formed on Thursday and we are seeing some hesitation. This is what I amtalking about in the SPY analysis above: mini breakouts followed by almost immediatepullbacks. For MDY, I am watching the April trendline and last week’s low. A movebelow 127 would break both and be bearish for mid-caps. Watch the home-builders for clueson this index.
***Sectors***
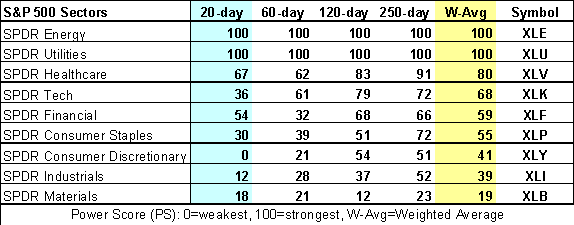
Even though this table shows more strength than weakness, I am still concerned withsector leadership. Yes, it is like an old record, but the market remains on a defensivefooting with Energy, Utilities and HealthCare leading the way higher. These are thepreferred sectors for long positions. Technology grabbed the fourth spot though and sportsa bullish Power Score above 68. As long as Tech holds up, the S&P 500 and broadermarket should remain strong. I am also concerned with the Consumer Discretionary sector,which is the most economically sensitive and has a Power Score below 50. This sector issuddenly lagging the market.

Consumer Discretionary SPDR (XLY): This sector, and by extensionthe broader market, could be in trouble. With the lower high at 35, the big pattern lookslike a triangle (blue trendlines). The red and green trendlines show the up and downswings within the triangle. After a doji in late July (red caret), XLY came down prettyhard and broke trendline support to turn the swing down. The next stop is support around32 and it would take a move above 35 for an impressive breakout.

Information Technology SPDR (XLK): XLK declined in August and istrading at its make-or-break level. The big pattern is a triangle as the sector has tradedflat for almost two years (what a snoozer). There are swings within the triangle and theindex is testing trendline support around 20.5. Also notice that there is support frombroken resistance around 20.5. This is the level to watch: a move below 20.5 would turnthe swing down and this would be bearish for the broader market. Conversely, a successfultest and move above 21 would surge for an assault on the prior highs.

HealthCare SPDR (XLV): Despite Merck’s problems with Vioxxand Pfizer’s problems with Celebrex/Bextra, XLV continues to be a top performer andshows great resiliency. The stock is trading back near the pre-Celebrax highs and remainsin an uptrend. The green trendline defines the current upswing and the stock formed abullish engulfing this week (provided its closes above 31.5). This reinforces supportaround 31 (30.75 to be exact) and calls for a continuation of the advance. This sector hasa strong Power Score, a strong uptrend and shows good relative strength. What more couldyou want?
***Industry Groups***

Semiconductor HOLDRS (SMH): Like the Information Technology SPDR(XLK), SMH is trading at its make-or-break level. The stock has been rising since Sept-04and broke above resistance at 35. This resistance breakout is holding and should beconsidered bullish as long as it holds. The stock declined in early August and then tradedflat the last three weeks (three doji). This just happens to be at support from the Apriltrendline. A break below the three week consolidation (36) would be quite negative andfurther weakness below 35 would negate the prior breakout. For now, the evidence stillfavors the bulls and we should expect higher prices.

Software HOLDRS (SWH): SWH could be the one to watch. Thisrepresents the biggest sector within the Nasdaq and features stocks such as MSFT, ORCL,SYMC, CA, SAP, ADBE and INTU. The stock has been zigzagging higher the last five monthsand recently "zagged" to trendline support. A bullish engulfing is taking shapethis week and support at 35 is confirmed by the June lows. Confirmation of the bullishengulfing with a move above 36 would start another "zig" higher and target amove above the July high.

Oil Service HOLDRS (OIH): Like West Texas Intermediate Crude(WTIC), OIH is getting overextended and ripe for either a pullback or a consolidation. Thestock advanced with a rising price channel and moved above the upper channel trendlinethis week. That is overextended, but not bearish. There are two ways to work off thisoverbought situation: trade sideways or correct. Either way, the target is brokenresistance around 100. Shorting at current levels offers a good risk-reward ratio, butthis is a top picking exercise reserved for only the nimblest of traders.
***Inter-Market***
US Dollar Index: Resistance at 89 has held and the US DollarIndex is weakening in the face of falling US interest rates. Why are interest rates andcurrencies tied? Countries offering the highest interest rates, lowest inflation andeconomic/political stability, attract the most foreign money. When US interest rates fall,lower returns make US Dollar denominated bonds less appealing to foreign investors. Sure,falling interest rates boost bond prices, but a falling US Dollar negates that return.
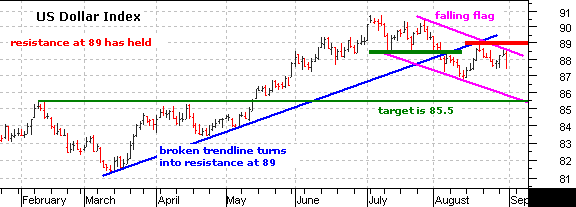
Turning to the price chart, the US Dollar Index broke below the trendline extending upfrom March and this trendline extension turned into resistance at 89. The two monthdecline may evolve into a falling flag and the initial downside target is 85.5 (brokenresistance and the lower flag trendline). A move above 89 would cut short the decline andargue for a move higher.
Gold: As the US Dollar moves to a three month low against the Euro,gold and gold stocks are catching a strong bid. It has been a wild and wooly ride thisweek, but the end result is bullish and I expect a move towards 500 (spot) and 50 (GLD).
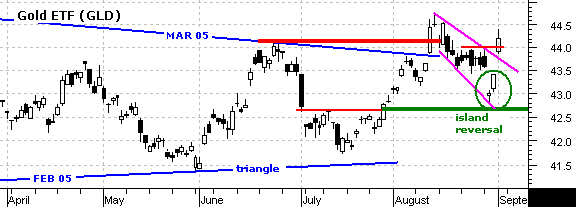
On the price chart, the StreetTracks Gold ETF (GLD) gapped down to support at 42.7 andthen gapped above resistance at 44. The two gaps form an island reversal and the breakoutis bullish. First, notice that broken resistance turned into support at 42.7. This is abasic tenet of technical analysis. Second, even with the gap, the decline looks like afalling flag that is widening. I have noticed these types of flags (widening) before andthe breakout at 44 signals a continuation higher. Third, the long-term triangle breakoutis back in play and the upside target is around 500. Key support is set at 42.7 (430) andit would take a move below this level to turn bearish.
I flinched. Yes, we are all human and it happens to the most battle hardened of us.Wednesday’s gap down made me flinch and I exited the GLD position in the ModelPortfolio for a breakeven trade. The gap was out of place and the prior 9 blackcandlesticks suggested a failure at resistance. Patience is golden and I should havewaited a day to see if cooler heads prevailed. Intraday decisions can be dangerous.Alternatively, I could have reacted to the gap by setting a stop just below the day’slow (42.81) and let the market decide. In hindsight, this would have been the prudentdecision. Live and learn.
XAU: The index broke resistance in early August and survived the mostrecent challenge to keep the uptrend in place. Notice that a flag formed at trendlineresistance (Jun-Jul) and the breakout is holding. There was a test around 95, but theindex found support from the trendline extension and upper range of the flag. The bounceover the last two days solidifies support at 93 and this is the level to watch for areversal of the uptrend. The upside target resistance (Nov-04 high) around 110.

Bonds: The iShares ~20-year T-Bond Fund (TLT) continues itsrampage higher and the upside target is around 100 by the end of September. Such a movewould be equivalent to the April-May surge and push the 10-year T-Note Yield below theJune low at 3.8%. This would be positive for banks, utilities, REITs and other interestrate sensitive stocks. For what it is worth, we cannot blame Katrina for the fall inrates. This move started well before the hurricane and the Fed follows the bond market.The affects of Katrina may influence the Fed, but the writing was already on the wall inthe bond market.

Oil: We can’t even blame Katrina for high oil prices. Prices werealready high and simply moved higher. In fact, the rate-of-ascent is pretty much intactand the current advance is similar to the Dec-Mar advance from 40 to 57 (42%). The movefrom prior four month surge.
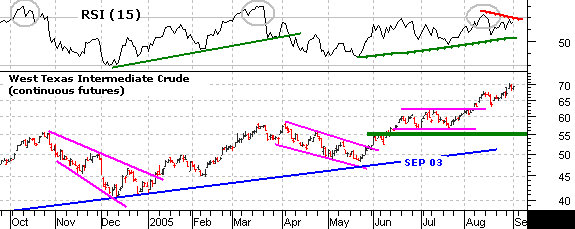
West Texas Intermediate Crude (WTIC) is getting more and more overbought. RSI movedabove 70 in August and formed a negative divergence over the last four weeks. The second(RSI) move failed to move above 70 and a lower high formed as WTIC moved above its midAugust high. This tells me to be on guard for a consolidation or a correction, but the bigtrend is way too bullish to consider shorts.
Model Portfolio: I am tempted to move back into gold, but will holdoff a view days to let the dust settle. I have tightened the stops in some of thepositions and am content to let these ride while the market jousts with support levels,high oil prices, falling interest rates and a weak US Dollar Index.
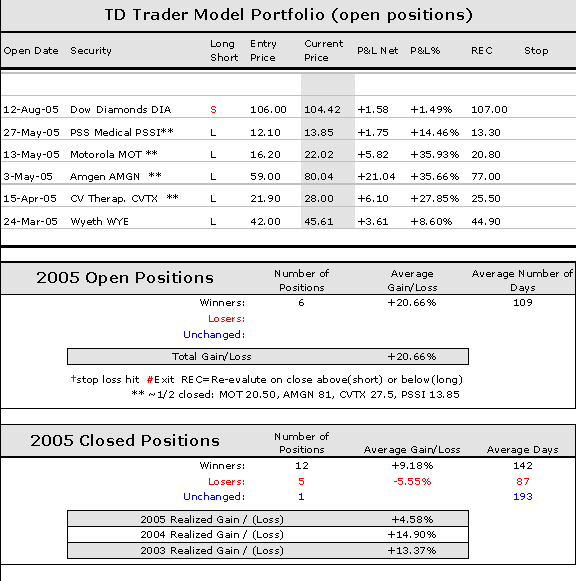
Model Portfolio Notes: L = Long Position, S = Short Position, Qty =quantity of shares, REC = Re-evaluation close (close below REC for longs and close aboveREC for shorts), SL = stop-loss. This is a hypothetical portfolio based on even dollaramount of $10,000 per position. $20 was subtracted to cover round trip commissions. Thisportfolio is meant for educational purposes and should not be considered a recommendationor solicitation to buy, sell or short these securities.
about: The TDT Report consists of a brief update on Tuesdays and afull report on Fridays. For shortened weeks (4 days or less), there will only be onereport on the last day of the week. Changes to the Model Portfolio and major indices aresometimes necessary between scheduled updates (Tuesday and Friday). As such, additions,deletions and/or updates to the Model Portfolio may sometimes be emailed between reports.These will also be added to the website.
Disclaimer: Arthur Hill is not a registered investment advisor. Theanalysis presented is not a solicitation to buy, avoid, sell or sell short any security.Anyone using this analysis does so at his or her own risk. Arthur Hill and TD Traderassume no liability for the use of this analysis. There is no guarantee that the facts areaccurate or that the analysis presented will be correct. Past performance does notguarantee future performance. Arthur Hill may have positions in the securities analyzedand these may have been taken before or after the analysis was present.
Power Score: The Power Score (PS) is based on absolute strength andthis can be compared against other securities for an idea of relative performance. ThePower Score (PS) measures the strength of a particular security for a given time frame:20-day, 60-day, 120-day and 250-day. These are trading days and roughly equate to 1, 3, 6and 12 month periods. A weighted average of the four Power Scores is then calculated with12-months weighing the most and the 1-month weighing the least. In general terms, readingsabove 55 are bullish and readings below 45 are bearish. The zone between 45 and 55 is atransition area that can go either way.


