
Market Overview: Mark Hulbert reports that Richard Russell is starting to turn bullish and recommends risk-oriented subscribers (speculators) to buy the S&P 500 ETF (SPY). This is quite a tectonic shift and Russell notes that he does not know why the market has “suddenly turned strong”.

I have followed Russell off and on since 1980 and have the utmost respect for his contributions to technical analysis. However, I must wonder why he thinks the market has “suddenly” turned strong. The majority of stocks have been strong for some time now. Perhaps the Dow, S&P 500 and Nasdaq are just now waking up to the message of the S&P 500 Equal Weight Index ($SPXEW), which recorded a new all time high in early August.
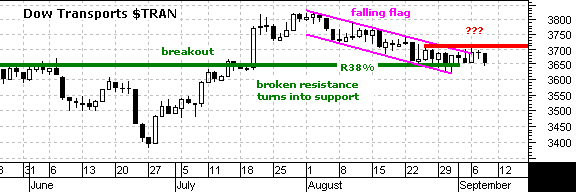
While Russell appears to be coming around to the bull market that has been underway for sometime, I am seeing signs of fatigue in the sector rotations and the NYSE breadth. The Dow Transports is lagging over the last two weeks and has yet to breakout. Weakness in this economically sensitive Average should have the Dow Theorists concerned.

The NY AD Line has a negative divergence working over the last few months. The NYSE Composite recorded a new all time high this week, but the AD Line remains below its January and July highs. A rather large negative divergence is brewing and this could spell trouble. The negative divergence shows that few NYSE stocks are participating in the recent advance.
As always, I will defer to the price charts for action. Recent breakouts in the S&P 500 and Nasdaq are bullish and have yet to be proven otherwise. In fact, these breakouts have yet to be challenged. The details are in the charts below, but I would watch 1-Sept lows for a breakout challenge and the late August lows for a breakout failure and trend reversal.

Have a great weekend -Arthur Hill Next: Update on Tuesday 16-Sep-05
***Major Indices***
Broadening Formations: Most books and commentary would have you believe that a broadening formation is bearish. I am not going to argue with Edwards & McGee or Murphy, but would like to point out a glaring exception within the S&P SmallCap Index (SML).
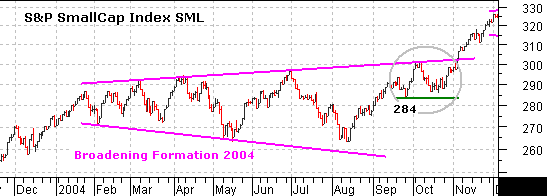
The S&P SmallCap Index (SML) formed a broadening formation in 2004. The lower lows and higher highs made for a volatile range that amounted to one big consolidation. The index broke resistance in Nov-04 and moved to new highs in 2005. The successful support test at 284 (gray oval) was critical for the bulls.
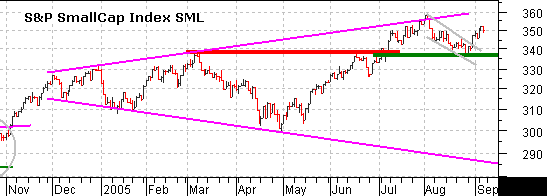
Fast forward to 2005 and another broadening formation is taking shape with lower lows and higher highs. The swings within the formation are big and really the only way to play such a pattern. Buying on resistance breakouts and selling on support breaks is just a recipe for whipsaw. The May-Jul advance is bullish and the August decline looks like a falling flag. The index bounced off broken resistance at 337 and there is no reason to be bearish as log as the late August low holds. In fact, this successful support test looks similar to the Oct-04 support test at 284. As long as SML holds 335, I will remain bullish and not worry about the broadening formation.
S&P 500: I see a similar situation for the S&P 500. The index has traced out lower lows and higher highs in 2005. The blue trendline extending up from April and the late August low define the current upswing.
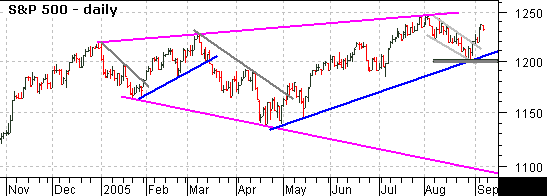
Most recently, the index broke falling flag resistance with a surge over the last two weeks. This solidifies support at 1200 and I will remain bullish as long as this level holds. A move below 1200 would put the broadening formation back in play and project weakness below 1100.
Nasdaq: After a correction in August, the Nasdaq broke resistance to signal a continuation of the current uptrend. This trend has been in place since the May breakout. In fact, I turned bullish in the TDT Report on 20-May (1971) and have remained bullish ever since.
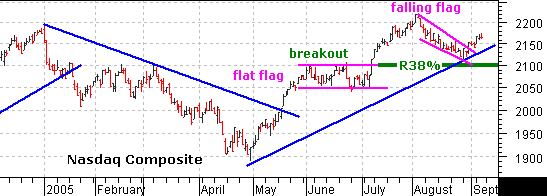
It is a tale of two flags for the Nasdaq. The index broke flat flag resistance in early July to signal a continuation higher and falling flag resistance in late August to signal a continuation higher. More importantly, this solidifies support at 2100 and we now have a closer level to watch for a trend change. Strong indices should hold their breakouts (like early July) and the bulls have nothing to fret as long as the April trendline (2130) holds.
***Sectors***

The top three sectors are HealthCare, Utilities and Energy. This kind of sector leadership reflects a defensive market with a lower appetite for risk. In addition, the Consumer Discretionary is wallowing near the bottom of the table with a relatively low Power Score. Strength in Technology is the glaring exception. The Information Technology SPDR (XLK) is ranked fourth and this puts it in the top half of the table, which is quite positive for the S&P 500 and broader market.
Consumer Discretionary SPDR (XLY): Readers know that I put a lot of emphasis on the Technology and Consumer Discretionary sectors. These are the two most economically sensitive and the first sectors to benefit when investors have a big appetite for risk. From the Nasdaq discussion above, it is clear that the bulls are reasserting themselves in Technology. I am also starting to see some encouraging signs in the Consumer Discretionary sector.
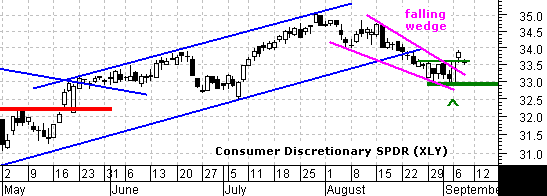
The Consumer Discretionary SPDR (XLY): formed a falling wedge in August, a bullish engulfing this week (green caret) and broke resistance at 33.6 in early September. The breakout was a few days later than the breakouts seen in the S&P 500 and Nasdaq. The breakout is better late than never, but XLY is getting an immediate challenge with a pullback on Thursday. I will be watching this key sector closely to gauge the health of the S&P 500. A continuation higher would be quite positive for S&P 500, but a failure and close below the early September low (32.9) would be bearish.
Finance SPDR (XLF): As the biggest sector in the S&P 500 and NYSE Composite, I am also watching Finance quite closely. The iShares ~20-year T-Bond Fund (TLT) broke falling flag resistance in mid August and this may signal lower rates ahead. REITs have already surged and Utilities remain strong.
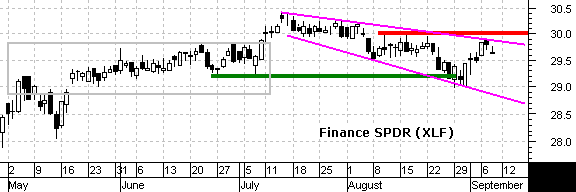
On the price chart, I see a falling consolidation that widened in August. This makes is a widening flag. It is a bit abnormal, but I have seen these before and we should be prepared to turn bullish on a break above 30. Also notice that the stock formed a bullish engulfing on 29-Aug and confirmed it with further strength in early September. I am looking for just a little bit more confirmation and believe a move above 30 would be bullish for the sector, the S&P 500 and the NYSE Composite.
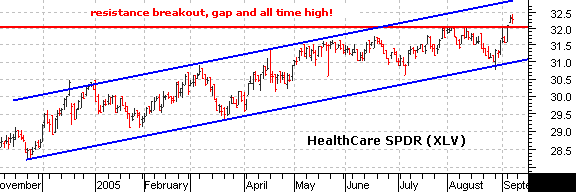
HealthCare SPDR (XLV): Mirror, mirror on the wall, who is the fairest of them all? Anais, of course! However, when it comes to stock market sectors, I find that HealthCare is the strongest AND has the most potential. XLV gapped above resistance this week and scored an ALL TIME high. While the S&P 500 has been a roller coaster in 2005, the HealthCare SPDR (XLV) has marched steadily higher and we want to be looking for stocks in this sector.
***Industry Groups***
I am going to shorter the time frame for a look at the Software HOLDRS (SWH) and Semiconductor HOLDRS (SMH). Both forged important breakouts this week and this will benefit the Nasdaq as long as both hold.
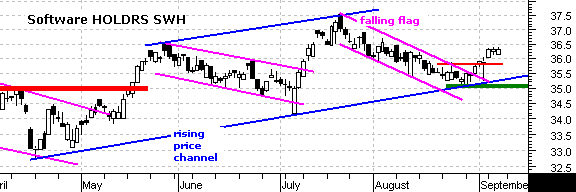
Software HOLDRS (SWH): SWH represents the biggest Nasdaq group with titans like MSFT, ORCL, SAP and SYMC. Leadership in this group propelled the Nasdaq higher over the last two weeks. The stock remains within a rising price channel since late April and recently bounced off the lower trendline. The falling flag represents a correction and the breakout signals a continuation higher. This breakout also reinforces support at 35 and I will remain bullish until there is a close below 35. The upside target is north of 40 over the next few weeks.
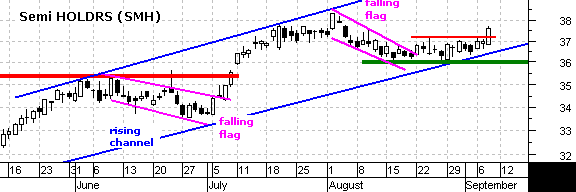
Semiconductor HOLDRS (SMH): SMH looked poised for a breakout and leadership role in mid August, but failed to follow through on the falling flag breakout. Instead, the stock went into a trading range and was late to the breakout party in late August. As with the Information Technology SPDR (XLK), it is better late than never. SMH broke resistance at 37.15 and this is providing the Nasdaq a needed boost from a key group. This breakout reinforces support at 36 and I will remain bullish until a close below this level. The upside target is north of 40 over the next few weeks.
***Inter-Market***
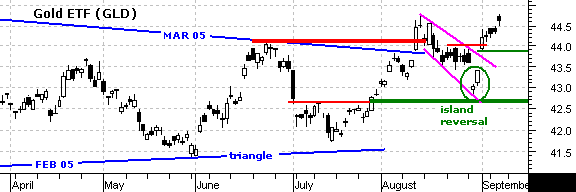
Gold: The StreetTracks Gold ETF (GLD) formed an island reversal and broke resistance at 44 to turn bullish last week. It was a whippy move in late August, but the bulls clearly have the upper hand as long as the gap holds. The larger pattern at work is a triangle that extends back to Feb-Mar and this breakout is quite bullish as long as it holds. A move back below 43.8 (438) would be negative and further weakness below 42.7 (430) would be bearish. As long as 43.8 holds, I expect a move towards 50 (500).
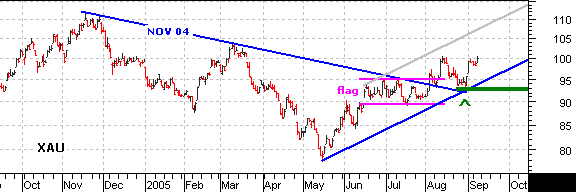
XAU: Gold stocks are also in bull mode with the recent breakout at 95 and successful support test at 93 (green caret). A move towards the Nov-04 high is expected as long as 93 holds.
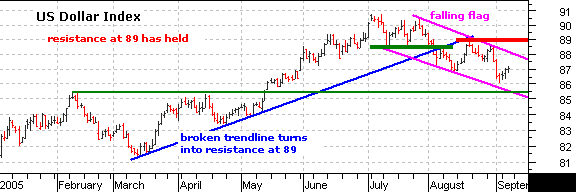
US Dollar Index: Gold is benefiting from renewed weakness in the US Dollar Index. The current trend is down, but traders should watch that this falling flag does not evolve into a bullish correction. There is support at 85.5 and it would take a move above 89 to confirm the falling flag. This would call for a continuation of the Mar-Jul advance and be negative for gold.
Model Portfolio: Given the recent breakouts in the Semiconductor HOLDRS (SMH), Software HOLDRS (SWH), S&P 500 and Nasdaq, I am going to set a tight stop on the short position in the Dow Diamonds (DIA). It was looking good two weeks ago, but recent gains have brought the position back to breakeven. The Dow is one of the weakest of the major indices, but there is no sense holding on further strength and I will set a stop at 106.60. PSS Medical (PSSI) suffered its second big loss in as many months with a gap and high volume decline. This is not the stuff of bullish stocks and I will exit the remainder of this position (~13.25). See the Model Portfolio table for other adjustments.
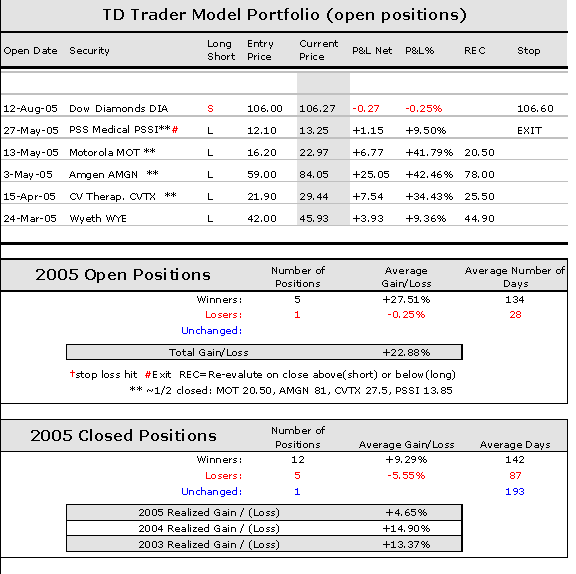
Model Portfolio Notes: L = Long Position, S = Short Position, Qty = quantity of shares, REC = Re-evaluation close (close below REC for longs and close above REC for shorts), SL = stop-loss. This is a hypothetical portfolio based on even dollar amount of $10,000 per position. $20 was subtracted to cover round trip commissions. This portfolio is meant for educational purposes and should not be considered a recommendation or solicitation to buy, sell or short these securities.
About: The TDT Report consists of a brief update on Tuesdays and a full report on Fridays. For shortened weeks (4 days or less), there will only be one report on the last day of the week. Changes to the Model Portfolio and major indices are sometimes necessary between scheduled updates (Tuesday and Friday). As such, additions, deletions and/or updates to the Model Portfolio may sometimes be emailed between reports. These will also be added to the website.
Disclaimer: Arthur Hill is not a registered investment advisor. The analysis presented is not a solicitation to buy, avoid, sell or sell short any security. Anyone using this analysis does so at his or her own risk. Arthur Hill and TD Trader assume no liability for the use of this analysis. There is no guarantee that the facts are accurate or that the analysis presented will be correct. Past performance does not guarantee future performance. Arthur Hill may have positions in the securities analyzed and these may have been taken before or after the analysis was present.
Power Score: The Power Score (PS) is based on absolute strength and this can be compared against other securities for an idea of relative performance. The Power Score (PS) measures the strength of a particular security for a given time frame: 20-day, 60-day, 120-day and 250-day. These are trading days and roughly equate to 1, 3, 6 and 12 month periods. A weighted average of the four Power Scores is then calculated with 12-months weighing the most and the 1-month weighing the least. In general terms, readings above 55 are bullish and readings below 45 are bearish. The zone between 45 and 55 is a transition area that can go either way.


