
S&P 500 CASH
SPX CASH: 5-Day Projected Support and Resistance levels: High - 1255; Low - 1230
DEC SP: 5-Day Projected Support and Resistance levels: High - 1261; Low - 1236
SPX CASH: Monthly Projected Support and Resistance levels: High - 1232; Low - 1188
SPX CASH: Yearly Projected Support and Resistance levels: High - 1292; Low - 1135
From last weekend: The action seen last week may give just slightly better-than-even odds that the 45 and 90 day lows are in place - though I am going to be looking for additional confirmation of this in the days ahead in the form of a daily close above the 45/90 day VTL resistance line from the daily chart. So far the lowest low seen came on August 30, 2005 at 1201.07 - which is within the normal bottoming range - though, with the normal plus or minus variance with the 45 and 90 day components there is no solid guarantee of a low in place until a close above trendline resistance is seen. But, if a new low were to still be out there then it should not be making lower lows going past 9/16/05. Should the SPX hold above the 1201.17 swing low by this Fridays close, even if trendline resistance is not overcome by then I would give better than 75% probabilities that the 45 and 90 day down phases are completed.
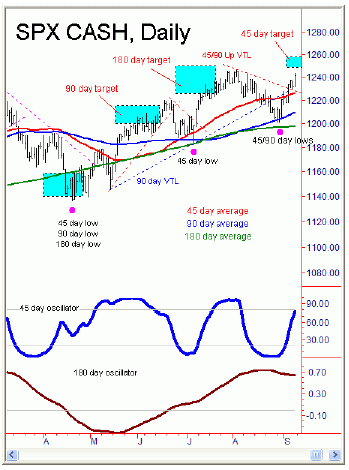
Current analysis: As per the notes from last weekend, the SPX had better-than-even odds that the 45 and 90 day lows were in place at the 1201.07 swing low - but needed additional confirmation in the form of a daily close above trendline resistance. This was in fact seen on 9/6/05 with the close above the 1233 area on the SPX. If correct, then the index should be headed for a try at the area which I now see as new first swing resistance - the 1253 SPX CASH area - but could in fact be headed on up for a
possible test of the 1270s before the current 45 and 90 day up phases are completed in the coming weeks.
The Hurst Time Cycles
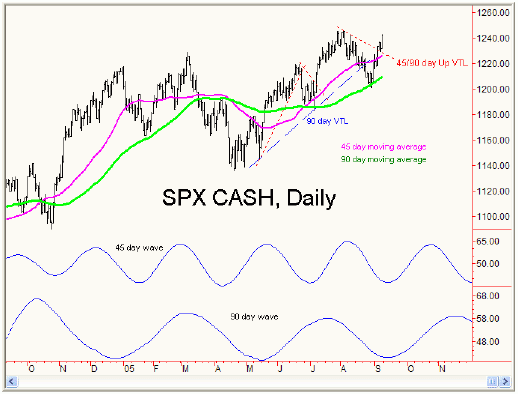
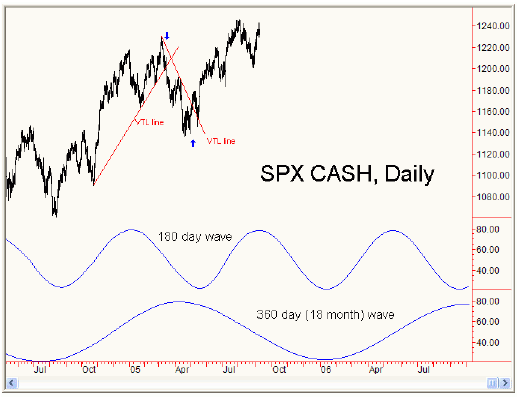
From the cyclic table on page 1, the 45 day cycle is now seen as 7 trading days and as bullish, having confirmed the last low for this component at the 1201.07 swing low that was made on 8/30/05. The 90 day cycle is also now seen as 7 days along and is bullish. For the bigger cycles, the 180 day (9 month) cycle is seen as 99 days along and is viewed as bullish and will remain so into early Autumn. The larger 360 day (18 month) component is 271 days along and remains bearish, next set to bottom out in the first few months of 2006. The largest daily cycle - the 1080 day (four year) component - is presently seen as neutral at 734 trading days along and will move to a bearish labeling at the closing of trading on 9/30/05 and then will remain so into the Autumn of 2006. In terms of open price projections, in the daily outlooks the smaller 20 day cycle confirmed an initial upside target to 1229-1233 SPX CASH, which was easily hit on 9/6/05. At the closing of trading on 9/7/05 the 45 day cycle confirmed an upside target to 1247.61 - 1257.93 SPX CASH, which is now good through the closing of trading on 9/26/05.
The 45 & 90 day cycles
From last weekend: Once the next 45/90 day low is in place, the odds will then shift back in favor of new highs being made on the next 90 day up cycle phase. The minimum expectation with price would be for a rally in the 3.6% region or higher - but with good-odds that a rally of 5% or more would be in progress. If the current down cycle has bottomed at the 1201.17 swing low, then the lower percentage rally - at minimum - would target a complete test of the 1245.86 swing top, while the upper end range would allow for prices to go as high as the 1261 area on the 45/90 day up phase; new swing resistance would move up from the 1240-1252 region to the 1252-1266 area.
Current analysis: As per the notes from last weekend on the 45 and 90 day cycles, if a low was made at the 1201.07 swing bottom (now confirmed), then the probabilities favored that a minimum test of the 1245.86 swing top from early August will be seen here. Having noted that again this weekend, I think that prices will travel on higher now, with the new weekly projected resistance high at the 1255 area now acting as an upside magnet to price in the coming days. New support will be at the 1218-1230 region and should ideally hold any near-term downside if the above is correct.
As per the notes from recent weeks regarding time, the longest that a drop had taken with the 90 day cycle in the current pattern had been 31 trading days off the peak, which indicated nearly 100% odds that this component would seen its bottom made on or before 9/16/05 - obviously now satisfied with the recent action. On the current up cycles, the minimum expectation would be for a rally that lasts at least 15 trading days or longer before peaking out, but could last as long as 25 days before the 45 and 90 day cycles try and form their next tops. As well, my expectation with the larger 90 day cycle is that it should be bearishly translated with time, with a peak for this component ideally being made before the 45 trading day mark off the lows (i.e, on or before November 1, 2005).
The 180/360 Day Cycles
The 180 day cycle is still seen as at bullish here and should ideally hold up into early Autumn. The minimum rally for this component in recent years, while in its current configuration, has been in the 12% range, which would still indicate a potential test of the 1272 region or higher could be seen before this cycle tops out; this remains valid as long as the 1136.15 swing low holds the downside action in the weeks and months ahead. As per the notes from recent weeks, in terms of time the probabilities still tend to favor a high with this cycle that forms on or near (+/- 15 trading days) of October 10, 2005.
The larger 360 day (or 18 month) cycle is heading down. This larger cycle should begin to exert its influence on the indexes from October/November and into early 2006, which is where both the 180 and 360 day components are set to bottom out. In terms of price, the minimum correction into 180/360 day lows has been in the 7-10% range from peak to trough - and could be more, depending of course on the larger four-year component. In other words, if the four year cycle tops in the second phase (or, with the current 360 day cycle), then the correction could be even greater than 10%. But, if the correction is less than 10% going into the next 180 and 360 day combo low, then the four-year cycle could even form a higher peak at some point next year. Based upon some of the recent notes here, my current expectation now favors that the four-year cycle has slightly better-than-even odds at seeing its peak made at some point in 2006 - which then tends to favor that the correction into the next 180/360 day bottom will hold at or below the 10% range.
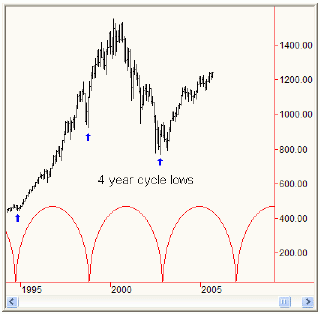
The 4 Year Cycle
The last four year cycle last bottomed in October, 2002 and is next projecting a low between the months of August and November of 2006. With its current configuration, the minimum decline off the top with this component - once it peaks - should be in the 17-20% range, possibly greater. In terms of time,the decline into this cycles next trough should take 3-12 months before bottoming out. Regarding the current four-year up cycle, the odds are better-than-even (57%) that prices will not get past the 1367 mark on the SPX before the current four year cycle peaks out - and about 90% odds that thecurrent four year upward phase will not get past the 1466 area before peaking.
Going back to the notes from recent weeks on the current four-year cycle, my speculation has been that its next low could be that of a higher bottom; that is, it could hold above the prior low of 768.63 SPX CASH which was recorded on 10/10/02. This is due to the fact that none (0%) of the four-yearcycles that were making higher highs on or past the 34 month mark went on to make a lower low on the following four-year down phase.
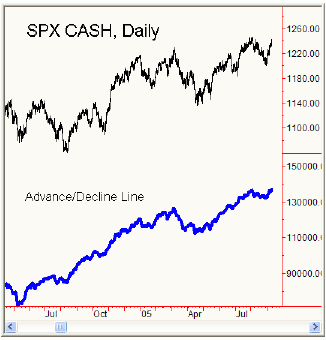
Adding to the notes from above, in looking at the 19 rotations of the four-year cycle throughout history that made a higher low on their following swing down, what I found was that 12 of the 19 (or 63%) actually peaked in the third phase - while only 7 of the 19 (37%) peaked in the second phase. Thus, if past history is any guide here, we can make the inference that the odds may slightly favor the four-year cycle holding off its top until at some point in 2006. And, with the third phase looking set up to peak in the Spring or early Summer of next year, it could be there that has the best-odds at peaking this larger four-year component. This to me is further confirmed by the action in the advance/decline line, which has already broken to new highs at Fridays close. As per the notes from recent months, the probabilities still tend to favor that the A/D line will top out before the actual market on the current four-year up cycle.
NASDAQ 100 INDEX
5-Day Projected Support and Resistance levels: High, 1624; Low - 1593
Monthly Projected Support and Resistance levels: High 1605 - Low, 1528
Yearly Projected Support and Resistance levels: High - 1795; Low - 1461
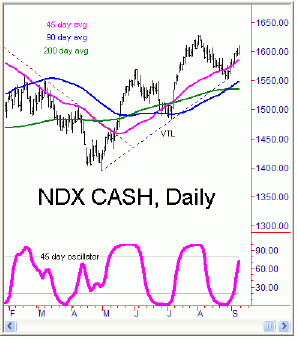
Last weekend: the technical action - in addition to Mondays key reversal day to the upside - indicate above-average probabilities that the 45 and 90 day lows may now be in place and the up phases of each now back in force - at least on this index. If a 45 and 90 day low is in place here, then the expectation would be for a rally in the 4 to 6% range or better to be seen, which would take us back to or above the 1628 swing top that was seen in early-August. In terms of time, as with the SPX the odds would favor a rally of at least 15 trading days before topping out here - and could actually last as long as 25 trading days before peaking.
Current analysis: As per the notes from last weekend, the probabilities had favored that this index had seen its bottom with the 45 and 90 day cycles, and, if true, was in the processof a 4-6% rally with the upward phases of these same cycles. 88% of the 45 day up phases while in thecurrent pattern have actually seen rallies of 5.5% or greater, which indicates better-than-average odds that the index is going to test or make a move above its 1635.70 swing topthat was seen in December of 2004. In terms of time, it looks like no important top should be seen here prior to 9/20/05 - and with at least even odds that the current rally will not find its peak until sometime during the month of October, 2005.
As with the SPX, the same probabilities infer that the current 90 day up cycle phase will be bearishly translated, which means a peak before the 45 day mark - or November 1, 2005. For now, first support will be between the 1578-1593 region, which should hold the near-term downside if the above is going to play out.
DJIA/DOW INDUSTRIALS
5-Day Projected Support and Resistance levels:Projected High, 10811 - Projected low, 10563
Monthly Projected Support and Resistance levels: Projected High, 10600 - Projected low, 10230
Yearly Projected Support and Resistance levels: Projected High, 11405 - Projected low, 10246
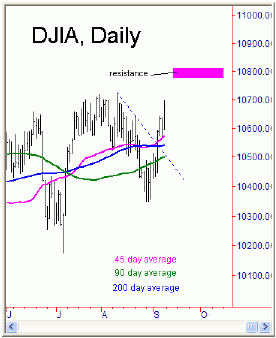
Last weekend: for the first time in several weeks, the weekly projected support low was not approached - which may be a an early indication that the down cycles are finishing on this index and that the up cycles are starting to assume control. If the above is correct, then we need to see additional confirmation in that of a daily close above the dashed blue downtrend line, shown on the daily chart at left. Once the 45 and 90 day down cycles are complete here, then I have sketched on this chart (in black) a pathway that the index could take in the next 3-5 weeks with the next 45 and 90 day cycle up phases; this path would target a test or a (ideally) a move back above the 10,719.41 swing top by early Autumn.
Current analysis:The DJIA did take out trendline resistance on a closing basis last week, hitting 10,695.92 at the intra-week highs and also closing near the highs for the day and for the week - which should indicate additional strength will be seen into the new trading week. As with the other indexes, the odds favor that the 45 and 90 day up phases are in force, and - if correct - we should see higher prices in the coming days/weeks. The next logical magnet to price on the DJIA would be the newly formed swing resistance bar, which now resides at the 10,775-10,810 region and is shown in magenta on the chart at left. Current support will move up to the 10,563 weekly projected support low, +/- 35 points in either direction.
Using the rule of harmonics, the odds favor that the next 90 day cycle peak will be the peak for the larger 180 day cycle -and thus the peak for the even larger 360 day cycle. Ideally this peak will be seen plus or minus 15 trading days of October 10, 2005, but more on this as we move ahead in the coming weeks and as additional technical indications begin to come in.
SPX/NDX Trader Commitments Analysis
From last weekend: the commercial short-covering was viewed as a net positive here - and the fact that we saw more of the same in the most recent trading week is an added positive here. It should also be interesting to see what these groups do in the next week or two, and if either group were to move to a net long position (speculation for now) it could be a very bullish indication for the next 3-5 weeks. My guess is that at least the SPX group will not cover all shorts, but will instead wait for the next 45 and 90 day top to put their recentlycovered shorts back on for the anticipated decline into early 2006, while the NDX group may end up reversing to the long side for the next wave up.
Current analysis: Last week SPX commercials covered another 3,151 shorts, which brings their current net short total down to 28,761 contracts, as of the closing of trading on 9/6/05. NDX commercials also exited shorts to the tune of over 3,000 contracts, which actually now puts this group now net long 790 contracts as of the same 9/6/05 close.
As per my notes from last weekend, I had speculated that the commercial short-covering was a net positive indication and that the NDX group could be the one to reverse to the long side, which they did in fact do last week. Both of the above have bullish implications for now, though this may not last beyond early October as the 90/180/360 day cycles try and form a top. As well, we will now want to be looking for both groups to start to add back in on the short side in the weeks ahead, which - if seen - would be an early indication that a larger peak is forming here. Stay tuned.
Jim Curry
Market Turns Advisory
Email: jcurry@cycle-wave.com
Disclaimer - The financial markets are risky. Investing is risky. Past performance does not guarantee future performance. The foregoing has been prepared solely for informational purposes and is not a solicitation, or an offer to buy or sell any security. Opinions are based on historical research and data believed reliable, but there is no guarantee that future results will be profitable. The methods used to form opinions are highly probable and as you follow them for some time you can gain confidence in them. The market can and will do the unexpected, use the sell stops provided to assist in risk avoidance. Not responsible for errors or omissions.
Copyright 2005, Jim Curry.


