—THE CYCLES—
We have been staring at stock market charts with wonder and curiosity for almost 40 years, but no matter how long it has been, there are always new patterns to discover. Usually, at least once a month prior to writing the newsletter, we work back in time from the current time period. Computers have made the task far easier than it used to be. In the “good old days,” you would have to count back from the current time period a certain number of days, weeks, or months until you reached a prior top or bottom. You would then note the length of the period and count back from the high or low just measured to see if that count took you to another high or low. More often than not, it did not, and so you returned to the current time and counted backwards to the next high or low going back in time. It was a painstaking process, but often an exciting one. To see how these cycles and turning point patterns recur almost magically on stock charts often borders on the mystical.
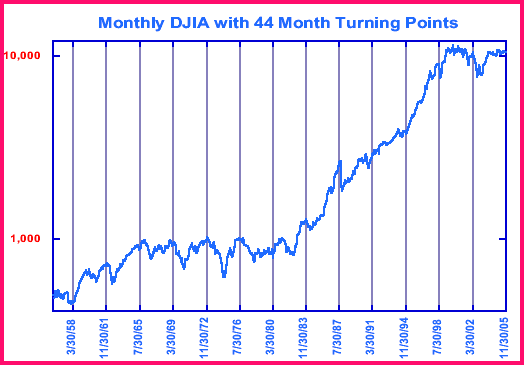
We had that experience again this week as we perused a monthly chart of the Dow Jones Industrial Average in search of longer-term cycles or turning points. The results of that search can be seen on the front page chart. Although the majority of the turns on the front page chart are market tops, there are enough bottoms that occur in the mix to justify calling it a turning point pattern rather than a cycle. We prefer using the terminology “turning point pattern” for equidistant time periods containing both tops and bottoms and reserving the word “cycles” for equidistant time periods that terminate in only tops or only bottoms. The specific pattern displayed on the front-page is a turning point pattern of 44 months duration. Because we believe the pattern could be crucially important over the next month or two in determining the market’s longer-term prognosis, we are going to move backward in time to each of the prior turning points over the past half century to give you an idea how important the majority of these turns have been.
Although we will be going back as far as 1958 and covering all the turns of the past half century, we should make it clear that there were some turns of paramount importance that occurred prior to 1958. There was a cycle low due in July 1921. One month later, the Dow registered a low that would begin the grand march up to the frothy speculative top that would not be seen until just over eight years later. The August 1921 bottom was one of the more important market bottoms of the past century.
Perhaps the most important bottom of the past century occurred in July 1932. This was another exact bull’s-eye for the 44 month cycle. In this case, the market made a price bottom inthe exact month of the 44 month turning point resolution and has never since returned to that bottom. In the case of the August 1921 bottom, the market held above that low for more than a decade.

Another important turning point was due in November 1939. In this case it was a market top with the closing monthly high on the Dow Jones Industrial Average occurring in October 1939. That closing market high was not to be surpassed for the next five years. Let’s move now to the more recent history of the past 50 years.
March 1958— the market had been consolidating its losses from the July 1956 closing high as March 1958 was approached. From that point, the market began an advance which would last into early 1966. The March 1958 prices on the Dow have never since been approached.
November 1961 — this month marked the exact intraday high on the Dow prior to what many refer to as the Massacre of 1962. The decline from the November 1961 intraday high fell just short of 30% at the intraday low in June 1962.
July 1965 — this was one of the least dramatic of all the 44 month turns. A bottom occurred one month earlier that was to lead up to an important market top in February 1966, but the February 1966 top was a far more important turning point then the June 1965 bottom.
March 1969— this was another important market top. It occurred two months later than scheduled, but the high registered at the close in May 1969 would not be surpassed by more than 10% until over 10 years later. November 1972 — the monthly closing high occurred one month later but the importance of this high is easily verified by the fact that it led to the second largest Dow decline of the 20th century.
July 1976 — this was another top of importance in this sequence of three important tops around the 1000 level between March 1969 and July 1976. The actual closing monthly high occurred one month earlier in June 1976 and was matched once again in December 1976. Those highs would not be surpassed convincingly until over six years later.
March 1980 — this was another bull’s-eye as it marked a very important bottom that has never since been penetrated. November 1983 — this was another closing monthly bull’s-eye as it marked a market top which, although it turned out to be a non dramatic top, nevertheless was not surpassed until over one year later.
July 1987 — this turn, predicted for July 1987 did not occur until the following month but its subsequent importance needs little further explanation. It led to the crash of 1987. March 1991 — this turning point should probably be used as a pointer to the January 1991 bottom, two months prior, although it is interesting to note that the closing price in March 1991 has never since been approached or violated either. November 1994 — what more can we say? November 1994 marked the exact intraday low on the Dow prior to arguably the greatest stock market advance in history over the next 5+ years.

July 1998 — this one could go either way. Two months prior to July 1998 saw a top which led to a sharp decline into August-September of that same year. It is easy to argue, however, that the more important turning point occurred at the monthly closing low one month after July 1998. That low led to the final march up to the Dow’s all-time high in January 2000. Perhaps more importantly, the August low monthly close of 7,539.07 has never since been penetrated although it was approached at the October 2002 bottom.
March 2002 — this marked the exact closing and intraday high for the Dow prior to the final sharp decline into October 2002 and March 2003. Although the levels of March 2002 have since been regained by the Dow, it is interesting to note that there has been no Dow monthly close more than 3.6% above the March 2002 monthly close.
When is the next turning point due? If you look over the dates given above, it is relatively easy to delineate. Notice that every third turning point occurs exactly 11 years from any of the above dates. The third turning point from November 1994 would be due exactly 11 years later in November 2005. We suppose that, because the market has been moving sideways around the 10,500 level for almost two years, a bull could call it a high level consolidation prior to another upside explosion. We believe it is far more likely that a very important market top either has been seen or will be seen within 1-2 months of November 2005. Because we are in a period of potentially favorable market seasonality between now and at least the end of December, we must allow for the possibility that the turning point will be a high registered within one-two months of the scheduled November 2005 turn.
What we usually try to do when we deal with cycles or turning point patterns this long and this consistent is examine the history of the pattern. Going back to March 1958 there have been 12 resolutions of the pattern through March 2002. Those resolutions have averaged 1341 calendar days and 924.25 trading days. We prefer using calendar days because the trading day patterns may be inconsistent. For example, in late 1968 trading was suspended on Wednesdays because of a backlog of accounting procedures that needed to be performed due to the great relative volume seen during that speculative binge.
The average time period between exact resolutions is what we seek. For example, the 44 month cycle was due to resolve in July 1987 but, in retrospect, it was easy to see that the actual top prior to the crash occurred on August 25th, 1987. That is the date we used in calculating the exact resolutions. The average number of calendar days between all the resolutions of the turning point pattern from 1958 through 2002 works out to be 1341 calendar days. The last resolution of the pattern occurred on March 19th, 2002. If we add 1341 calendar days to that date, it takes us to November 19th, 2005. The largest variation in the cycle from the average number of days was 74 calendar days so we must allow that number of days on either side of November 19th, 2005 as the resolution window of the 44 month cycle. In the final analysis, the time window between September 6th, 2005 and February 1st, 2006 should generate another important market turning point. We should note that on September 9th, 2005, the New York Composite Index moved to a new all-time high and has not exceeded that high since then. That high was within the time window we just defined so it qualifies as a potentially important turning point. On the other hand, unless we see a dramatic decline before then, we will have to wait at least another two months until February 1, 2006 to be able to confirm where the important turn actually took place.

—TECHNICAL INDICATORS—
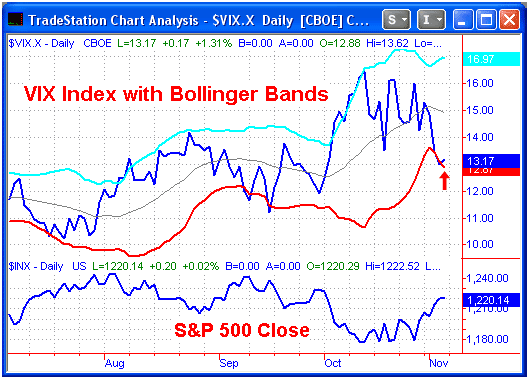
On our daily update dated February 3rd, 2005, we discussed a technical indicator which combined the VIX index (this is an Index which measures the volatility of options and helps to determine market sentiment) with standard deviation bands or Bollinger bands. Here is what we wrote for that update:
"Just today,...an article appeared in SFO magazine, an acronym for stocks, futures, and options, entitled, “ Is The Vix Dead?” written by Christopher P. Hendrix. Hendrix contends that good buy and sell signals for entry can be given by using the VIX index in association with Bollinger Bands using the standard parameters, namely a 20 day moving average bounded above and below by channels two standard deviations wide. Signals are generated by closes back into the envelope after closes outside the envelope. A reentry from an excursion above the envelope would be at least a short-term buy signal whereas a reentry from an excursion below the envelope would be at least a short-term sell signal. Hendrix claims the signals work on both daily and weekly charts and to a lesser degree, even on intraday charts. He also makes clear that signals should be used for entry purposes only because they do not always lead to signals given in the opposite direction. With that information in mind, we can give you the recent history of signals from the VIX index. Over the past six months since early August 2004, here is the sequence of signals. In this case, we are using the old VIX Index, not the new version that was reconstructed last year. There was a buy signal given on August 9th, another buy signal given on October 15th, a sell signal on December 27th, and, lo and behold, another sell signal today. That is the extent of the signals given over the past six months. It you are curious about other sell signals given in 2004, the only other sell signals registered occurred on April 6th and June 9th. Those signals were virtually perfect but do not make the mistake of thinking this indicator or any other indicator for that matter is perfect. False signals have been given in the past."
We have continued to follow that indicator over the past nine months and have watched it give some good timing signals. We have included a chart of that indicator in this section of the newsletter. The specific reason for its inclusion in today’s newsletter is the fact that it generated a sell signal today when the VIX index moved from below the lower band back inside the bands at today’s close. If you look back towards the center of the chart, you can see the last two sell signals that were issued on September 13th and September 19th. They were both well timed signals. You should also be able to delineate the two buy signals that were given in October, specifically on October 7th and October 13th. The October 13th signal is especially notable because it was given on the day of the exact closing low.
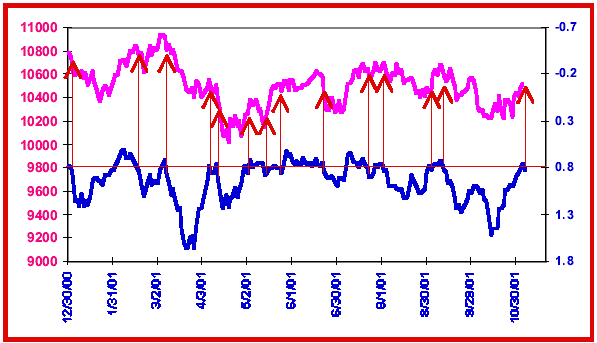
The next chart in this section shows the Dow Jones Industrial Average accompanied by our own New 10 TRIN indicator. The general rule is that a short-term sell signal is given each time the New 10 TRIN moves from a reading lower than 0.80 to a reading higher than 0.80. The arrows on the chart point to all the signals given this year. Note that the scale for the New 10 TRIN has been inverted so that movement on that indicator will more closely parallel the market. It is especially interesting to note that the New 10 TRIN also gave a short-term sell signal at today’s close to accompany the sell signal given by the VIX index indicator explained above. The market is now in a period of favorable seasonality that will last through at least the end of this calendar year. Our general expectation is to see at least a short-term decline from these current levels, then a final move up into the December- January time period. We continue to expect the possibility of seeing a “Sign of the Bear” signal at a final market peak whether that peak moves to new highs for the year or not.
—MARKET PROJECTIONS—
The New York Composite Index tends to give the most consistently accurate price projections. This past week it met nominal five week upside projections without generating any higher projections. Should the New York Composite Index close above the close of November 4th next Friday, November 11th, higher nominal 10 week projections will be generated. Because it has met nominal five week upside projections, however, without thereby generating higher nominal 10 week projections immediately, we favor a short-term downside resolution from current levels.
—MUTUAL FUNDS—
Fidelity Select switchers remain in 100% cash positions. Rydex switchers were instructed to sell the Rydex Tempest Fund and switch to money-market funds on a special telephone update which went online around 3:00 p.m. on October 28th. The fund was sold at a price of 43.33 for a profit of 2.1% on the trade.
Our seasonality program which we began trading in February and which entails being in no-risk money market funds 70% of the time is now up 23% in nine months. This program is available only to current management clients and to high net worth individuals. We have two different specific model portfolios-one for Fidelity select switchers and one for Rydex group switchers. How you distribute your own portfolio is up to you as an individual.
“Stockmarket Cycles” is published the first Friday of the month by Peter G. Eliades. Information is gathered as carefully as possible, but no guarantee can be made as to the accuracy of text or charts. The analysis of stock market cycles is more an art than a science. No guarantee can be made that recommendations will be profitable or will not result in losses. This subscription will not be reassigned without the consent of the subscriber. All information contained herein and given on the telephone update may not be reproduced or rebroadcast in any form whatsoever without the written consent of Peter G. Eliades.
1 year (12 issues) letters only $252.00 6 months (6 issues) with daily telephone update $261.00
1 year (12 issues) with daily telephone update $480.00 2 issue trial with daily telephone update $98.00.
Next Publication Date: December 2, 2005


