Three Peaks Domed House Top is Forming
Continue to Sell into Strength
By Jeffrey A. Hirsch
As the Dow dances with 11000 again it is becoming apparent to us that a major top is forming. Economists, market analysts and investors remain quite impressed with the data that has been released so for this year. This has contributed to the excessive bullish sentiment and complacency we are experiencing levels associated with tops.
Our 2006 Annual Forecast projects a first quarter 2006 high around Dow 11500. That is only 4% higher than todays new recovery high close of 11058.97. Despite all the cheerleading on the Street market internals have not been overly impressive and the major averages have struggled to make new highs. The Dow has inched up but NASDAQ and the S&P 500 remain below their highs.
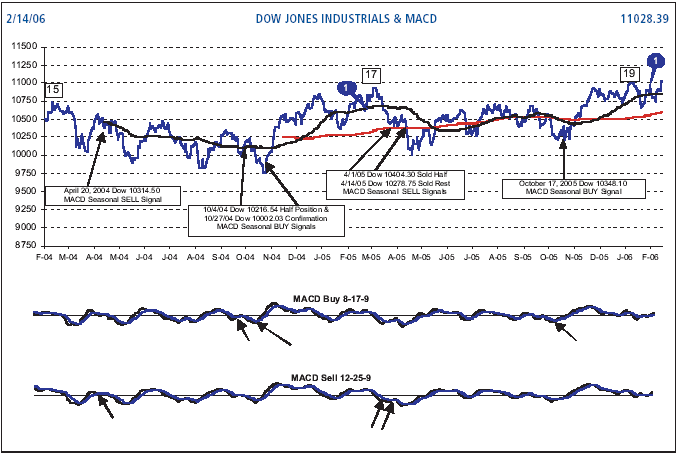
This brings us to the matter of the chart at the bottom of the page. The current Three Peaks and Domed House pattern we have been tracking is illustrated along with the end of the previous pattern. (Refer to the January 2006 and April 2005 issues for deep background on Three Peaks and Domed House Patterns.)
First, a little house cleaning. The final Point 28 low of the last pattern has been plotted at the April 20, 2005 low of Dow 10012.36. It is now clear to us that the last minor formation ended there. It was one of only three formations of the last 20 that did not return all the way back to the Point 14 beginning of the Domed House, falling to within less than 3% of that Dow 9750-level.
You will note that the current pattern closely matches the Basic Model in the previously mentioned issues. The time spans are shorter than the older model but our recent work in the April 2005 issue showed several instances of these shorter time spans in the minor formations.
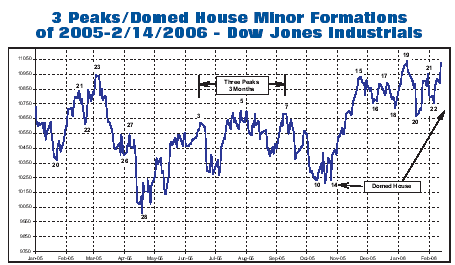
From here we anticipate another Point 23 top soon. Then a retreat to a Point 28 near Point 14 on October 27, 2005 at Dow 10229.95a correction of 7.5% from todays close. However, we believe this will only be the first stop on the way down to a major bear market bottom later this year.
We have also observed an extremely long Major Formation of the Three Peaks and Domed House that stretches six years back to 2000 after the Dow topped out at its alltime high. On page two in the Dow & MACD chart there are three numbers in boxes: 15, 17 and 19. These refer to the final stages of a major top that would be followed by a bear market that could return the Dow to levels not seen since 2003the March 12, 2003 Point 14 of Dow 7552.07 is the bad case scenario.
4th Year of Bull
Quite a bit has been made of the length of the current bull market, and rightfully so. Few have lasted this long. Of the 34 bull markets since 1900 only six have gone past three years. Todays Dow high moves this bull into sixth place. From the October 9th three-year anniversary date the Dow is up 8%. This is nearing the average returns expected from the fourth year of bull markets. Bottom line is that 79% of these bull markets do not last this long, which adds to our belief that this bulls days are numbered.
January Indicators
Our January Barometer and First Five Days Early Warning indicators gave positive readings this year but they do not have the best records in midterm election years and exogenous events can overpower these seasonal indicators. In the Almanac we say, Full years followed Januarys direction in nine of the last fourteen Midterm years. The other five were affected by geopolitical events or overarching bear markets. In 1966 and 1994 we were in the fourth year of aging bull markets. In 1966 the reality of Vietnam was sinking in after enormous wartime spending boosted the economy. In 1994 midterm battling between Democrats and Republicans flavored the atmosphere. In 1970, 1978, and 1982 continuing bear markets affected the trends in January, but the bear markets ended later in the year.
Also, the Dow Jones Industrials closed below its December 2005 closing low on January 20, triggering the December Low Indicator as detailed on page 40 of the Stock Traders Almanac 2006. This indicator has triggered 26 times since 1950. In all but one, the Dow has suffered further declines that average 10.7%.
As we mentioned last issue, an up January does not preclude us from a major bear market. January 1987 was the S&P 500s best January on record and we all remember the bear that culminated with the crash on Black Monday.
With our view of the market so languid and the end of the Best Six Months looming we are not recommending any new equities this issue and instead offer two bond ETF recommendations on pages 8 and 9. (For Subscribers Only)
We have also tightened up stops on all open recommendations in our continued effort to lock-in gains by selling into strength. Updates start on page 13 and updated current advice is in the Portfolio table on page 15. For next issue we are formulating a simple strategy to profit from a downturn in stocks.
Pulse of the Market
Folks may be excited about Januarys big retail sales number, but if you average the figures from December and January, the numbers are not that impressive. As we pointed out last issue the Dows 50- day moving average (black line) has proved important. When the Dow poked above this level in January, much like last January, it came back to that level (1). Once again it has climbed above the 50-day MA. But as it did last year we expect it to fall through the 200-day MA (red line).
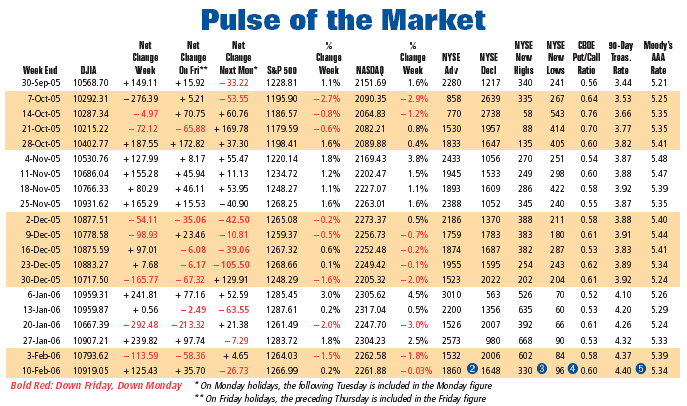
Market internals have not been impressive. The ratio of weekly NYSE advances to decliners has been flat to negative recently (2) and daily readings have not been spectacular either. New highs have dwindled and new lows are creeping up (3).
Daily Put/Call ratios have perked up lately indicating increased fear among option traders. But the weekly readings (4) have only begun to rise. This may be an early indication of a market top. Finally, rates are tighter than they have been in over 15 years (5). The yield curve remains slightly inverted and the new Fed Chairman seems more hawkish than expected. See the Proving Grounds on pages 6-7 on the history of Fed Interest Rate Policy Cycles.
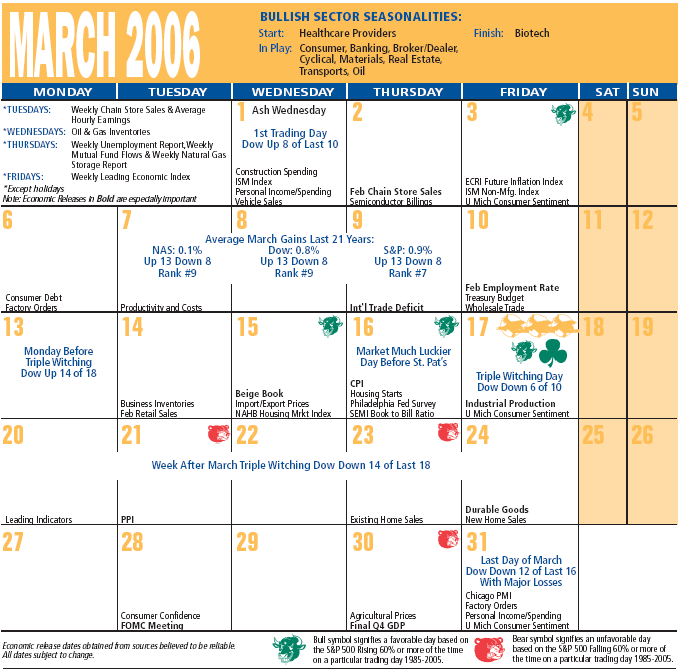
March Almanac-Beware the Ides of March
March is prone to early strength and second half weakness. We would not be surprised if this coincided with the bull market top. The day before St. Patricks Day is much luckier perhaps as it often falls on Triple Witching Day. This year it may be time to heed that infamous warning to Caesar.
The week after Triple Witching is downright frightful as the Dow has dropped 14 of the last 18 times. Marchs last trading day is also prone to selloffs as end-of-firstquarter portfolio restructuring has an impact. More stats appear in the Strategy Calendar on page 16.
January Barometer
PortfolioJBP
We received the annual update and final 2005-06 results on the January Barometer Portfolio for Industries (JBP) from our colleague Sam Stovall, Chief Investment Strategist, Standard & Poors. As detailed on page 20 of the Stock Traders Almanac 2006 Sam has tracked this portfolio of the top-ten performing S&P sectors every January back to 1970.
Several years ago we posited to the illustrious junior Stovall that since our January Barometer (as the S&P 500 goes in January, so goes the year) is so reliable perhaps the top industries or sectors in January would do well the year. Not only is this the case but the JBP has beaten the S&P over the next 11 months on average 16.3% to 6.9% (including
last years results).
The JBP from last year did even better. There was only one losing industry and the JBP tacked on 20.7% from January 31, 2005 through the end of 2005 versus only 5.7% for the S&P 500 over the same 11 months. Accompanying the results from last year is the JBP for 2006the top-ten S&P industries in January 2006. For more visit businessweek.com: under the Investing tab, Investing Columns, is Stovalls full report.
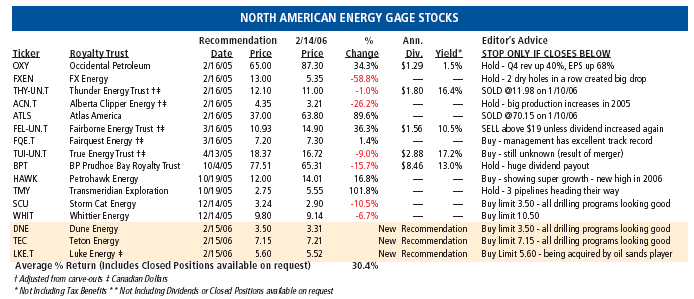
The North American Energy Gage:
The New New Math of Supply and Demand Includes Time
By Dave Kamm
Its widely known that the EIA (Energy Information Administration) has published figures that include a prediction of increased global usage of oil in 2006. While difficult to assess the degree, China is also expected to be the X factor in usage. According to the EIA, Chinas oil demand will average 7.4 million bpd (barrels of oil per day) in 2006. In addition there are unconfirmed reports floating around that China may be starting their own version of a strategic petroleum reserve.
On the supply side of the equation, EIA figures show that U.S. production of both crude oil and natural gas was lower in 2004 than it was in 2000. Figures for 2005 are not yet published, but Exxon Mobil production in Q4 2005 was down 3.6%. Thats only one data point, but its from an enormous producer. The MMS (Mineral Management Service) reported that 24% of oil and 15% of natural gas production in the Gulf of Mexico might still be shut in when the 2006 hurricane season begins.
Nigerian militants have said they will continue with their attacks on pipelines with an aim of reducing exports by 30% in February. As Africa's largest oil producer, the pipeline sabotage may become a significant factor
.
A shortage of tires in the coal industry has resulted in lower production estimates at some mining facilities. The tires in question arent routinesome weigh between five and ten tons, are over 10 feet in diameter, and can cost $50,000. Supplies are often limited. If the tire situation becomes chronic, it may create questions about the timing of future production from the oil sands in Alberta.
With much of the data indicating that demand factors are increasing and supply factors questionable, why did stocks in the energy sector tumble significantly in the early trading days of February? The XOI (an index of 16 leading energy stocks) and the EPX (an index of 22 exploration & production stocks) fell over 9% and 13% respectively in just nine trading days.
By my pencil, the quick declines tell us that the momentum and trading types are still very active in energy stocks. And, that the longer term investing segment of the market is still not large enough to mitigate emotional movements in the sector. When the going gets tough, demand for energy stocks seems to dry up. Thats the time ingredient coming into play. Proponents of the peak oil idea have a long-term focal point while the momentum monkeys often jump from sector to sector with rapidity. Thats one reason energy stocks can and do remain very volatile.
Our North American Energy Temperature Gage declined from a warm +56 decrees to just a bit below zero at -12 degrees. While the readings continue to fall, any reading below zero is a time for long-term investors to look for buys points. During the 2005 March-to-Mayenergy- stock-tumble our proprietary index dropped to a frigid 44 degrees.
As a basis for comparison, our temperature gage is designed to have (+) and () limits of 100. In a practical sense, we can recognize the risk levels in the stock group by our own reaction to temperature levels above +80 degrees we sweat, and the stocks are in a high-risk zone. At 20 the enthusiasm for energy stocks is similar to our desire to head outdoors, in other words, a lower risk level. At the current 12 degrees level, investor enthusiasm for these stocks is slight, and that means theres room on the upside.
Earnings reports are beginning to trickle in. In general they make very good reading. Thats no surprise, but drilling costs are rising and watching the expense side of the ledger will be key in the coming quarters.
New names this month
Dune Energy (DNE) is an early stage exploration & development company. Major activity (90%) is in the Barnett Share area (Ft. Worth) one of the current hot spots for natural gas. A Dutch investment company is major shareholder. Current production is small and drilling is basically developmental. Teton Energy (TEC) drills for natural gas in two of the most active basins in the U.S. Teton has partnered with a couple of well known energy entities and has ample capital to complete a 31-well drilling program in 2006. With zero debt TEC does not hedge natural gas sales. Luke Energy (LKE.T) is being acquired by a Canadian oil sands player, Connacher Oil & Gas (CLL.T). Luke is now producing natural gas and CLL wants to obtain dedicated production to use in their oil sands operation. Luke shareholders are to receive C$2.31 in cash and _ share of Connacher. A purchase of Luke gives the buyer Connacher at an 8-10% discount from current trading prices.
Dave Kamm is an Investment Advisor Representative with Raymond James & Associates, Inc. Member New York Stock Exchange/SIPC. Past performance does not guarantee future results. The market value of securities fluctuates and you may incur a profit or a loss. Dividends will fluctuate and are not guaranteed. The foregoing material does not provide complete descriptions. Send Dave your comments or questions to info@floridastocks.com. At the time of publication Dave Kamm, members of his family and clients may own shares of the stocks mentioned in this article.
Proving Grounds: Revisiting Federal Reserve Interest
Rate Policy HistoryAnticipating a Change in Bias
By Jeffrey A. Hirsch
& J.Taylor Brown
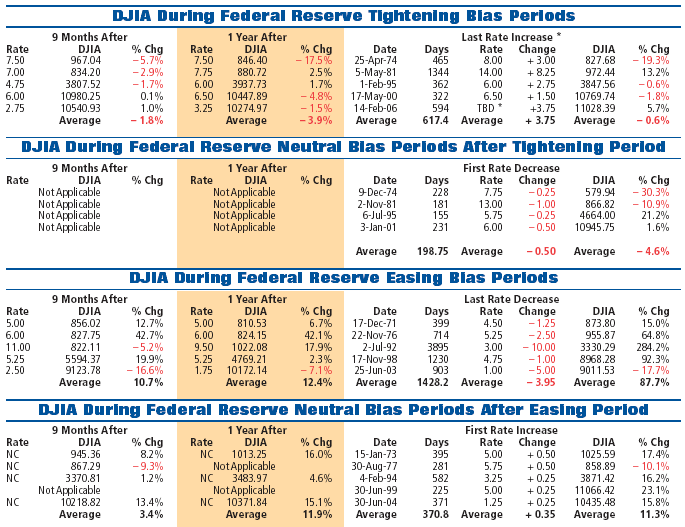
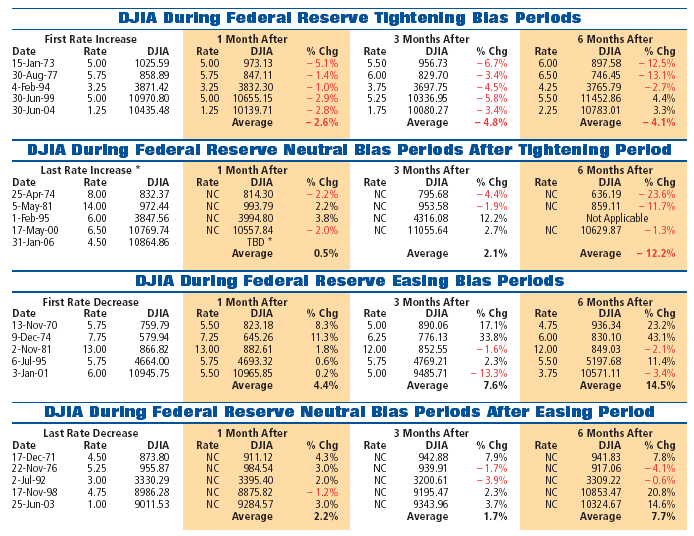
Twenty-one months ago we featured a study in these pages on the history of Federal Reserve interest rate policy changes and related market behavior. At that time in mid-May 2004 it was apparent that the period of extremely low interest rates we had enjoyed for over a year was about to end.
We analyzed the performance of the Dow Jones Industrials during Fed Tightening, Easing and Neutral Bias Periods. At the end we concluded: As long as the market environment continues to improve and the economy continues to grow, the market should react similar to the August 1977 and July 1999 shifts to tightening. Assuming Greenspan sticks to his guns (like there is a snowballs chance in Hades he wont) and the Fed increases rates in a measured fashion, the markets will react and recover within the first six months and will be back on their feet and off of the mat within the next year. This Bull is not ready to be put out to stud yet!
Turns out that has been the case. In the table you can see that after the current tightening period began on June 30, 2004 the Dow dropped slightly for three months. Then stocks recovered and bounced around for most of 2005 and presently the Dow is 5.7% higher than it was back on June 30, 2004.
Now the tables are about to turn. An end to this Fed Tightening Period is approaching and we believe it is a matter of months. Whether it is at the March FOMC meeting or May or June or beyond, it is expected to end sometime in the middle of 2006. They may even pause and then tighten further. There is also the matter of how the new Fed Chairman will communicate and act.
The tables here have been updated and reconfigured since the June 2004 issue. Our starting point for this study is the easing period that began in November 1970 after the May 1970 bottom. It was the first Fed cycle presided over by Chairman Burns and Fed behavior prior to that was somewhat erratic.
From 1970 through 1992 we use Discount Rate data as that was the prevailing benchmark of the time. In 1992 the Discount Rate and Fed Funds Target Rate reached the same level and afterwards the Fed Funds Rate became the benchmark. No interest policy changes occurred from 1992 to 1994. Fed Funds Target Rate data are used thereafter. This study illustrates the overarching Fed policy during predominate bias periods. Some minor tweaks in other directions do not appear in the table, the tightening tweak during the 1970- 1972 easing period does.
Current Observations
One glaring pattern is the extremely short time spans of the Neutral Bias Periods after Tightening Periods. All four are less than nine months long. The 1995 period is the only one
that was not followed by a substantial decline. The three in 1974, 1981 and 2000 were followed by substantial declines that culminated in major midterm election year bear market bottoms in 1974, 1982 and 2002. Clearly the Fed tends to overshoot on the tightening side. Their mantra of inflation fighting contributes to this. Plus, they also seem to be fond of giving themselves some extra ammunition for the next downturn. Having a few quarter-point cuts in their quiver allows for immediate economic goosing when needed.
As we approach the end of this current Fed Tightening Period we are especially drawn to the similarity between the present Period and the 1977-1981 Tightening Period. Both are substantially longer than the other Tightening Periods and rate increases are also significantly greater. (More is expected from the current period.) The end of the Tightening Period on May 5, 1981 was near the April 27, 1981 bull market top. A bear market followed with a bottom in midterm year 1982 on August 12 then came the longest easing period of the study and the super bull of the 80s and 90s. We anticipate similar market action this time around and have already assumed a defensive stance for 2006 and anxiously await the next major buying opportunity later this year.