Jerry Favors: Jerry Favors and I never met each other. Despite that, I like to think there was a strong bond between us. On more than one occasion, Jerry was very generously complimentary to me in his newsletter. I, in turn, told many people including our newsletter publishing colleagues, of my great respect for Jerry and his work. His knowledge and research into the work of prior market masters Edson Gould and George Lindsay were unmatched by any other market analyst. When a true Southern gentleman, Rick Redmont was kind enough to send me an almost complete collection of Edson Gould’s published works, I thought immediately of sharing them with Jerry. I told him he was more than welcome to spend as much time with them as he wanted but I would not release them from my possession. Jerry was excited about the prospect of doing that and he tentatively planned to fly out to California and spend a weekend with me, poring over Edson’s writings. I regret the meeting never took place. There is a strange passion within those who populate the stock market newsletter fraternity. I never spent any time with Jerry but I can guarantee you there were many occasions when he burned the midnight oil seeking out and attempting to predict the market’s tenuous footsteps into the future. He was a gifted and dedicated market analyst and the flame from his midnight oil has expired all too soon. Jerry passed away in his sleep this past week at the tender age of 52. I will miss his market insights. May his memory be eternal!
—THE CYCLES—
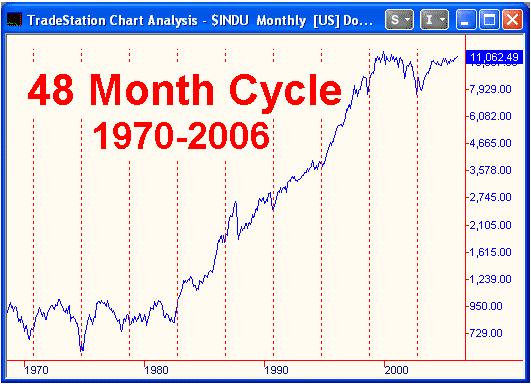
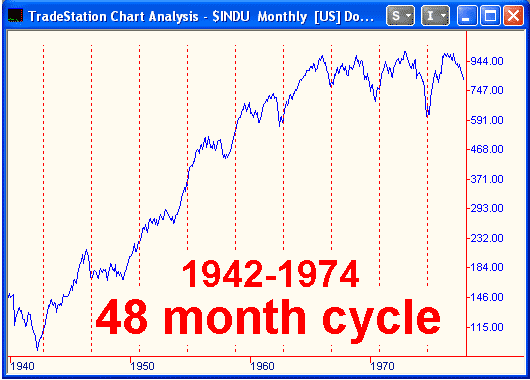
Perhaps it’s time to return to what a college course might call Cycles 101. Certainly the most often cited cycle and the cycle with the greatest degree of popularity is the 4 year stock market cycle. Its heartbeat has been consistent for at least the last 60-65 years. Even those who are not given to believing in cycles in the stock market are forced to admit, perhaps grudgingly, that there has been a 4 year pattern in stock market data for a very long period of time. Those of us who spend a great deal of time analyzing cycles and the market would probably call the four year cycle a 48-52 month cycle because with very rare exceptions major bottoms in the market have occurred 48-52 months apart. There is a suspicion by many, perhaps justified, that the so-called 4 year cycle in the stock market is nothing more than a reflection of the 4 year presidential cycle. The very simple charts that we are presenting in this section of the newsletter might be used to confirm that assumption. The two charts are monthly charts of the Dow Jones Industrial Average from 1940 to the present time. The vertical dashes on the chart begin in October 1942 and continue every 48 months through October 2002.

A few salient facts should be clear from a cursory visual observation. It is amazing how often those vertical dashes exactly 48 months apart have occurred at exact low points in market history. What is more important, however, is the fact that there has never been a failure of the pattern to produce sizeable profits over the following year or two and there has never been a period of risk immediately following any of the Octobers that fall at the vertical dashes of the 4 year pattern. Lest you are led to believe that this is a coincidence, we encourage you to at least admit that this has been true for the past 16 consecutive resolutions of this cycle.
Because the month of February has just ended and only eight months remain before the appearance of October 2006, we were curious as to the resolution of the October 4 year cycles between the end of February and the lowest point leading up to each October within the 4 year cycle. We went back 44 years to examine the last 11 timespans between February 28th (or February 29th) and the end of October for each 4 year cycle. We calculated the maximum vulnerability in the Dow Jones Industrial Average during those periods and discovered the average vulnerability was 15.6%. The ranges of vulnerability were as small as 1.7% (1978) and as large as 33.4% (1974). The Dow close of 10,993.41 this week on February 28th would have a vulnerability down to a low of 9282 if the average vulnerability is repeated this year. Current long-term sentiment data and valuation levels suggest the vulnerability could well be far greater but without any rationalizations at all, a move to the low 9,000s between now and October should not be surprising. In our November 4th, 2005 newsletter we wrote in length about a 44 month turning point pattern and suggested that the next turn on that pattern could well be a market top of significance. We concluded that discussion by writing, “In the final analysis, the time window between September 6th, 2005 and February 1st, 2006 should generate another important market turning point.” We suggested in that newsletter that we would probably have to wait until at least February 1st, 2006 to verify the next turning point in the pattern. As it turns out now, because prices on virtually all the major indexes have gone to higher highs since the cut off date of February 1st, the 44 month turning point resolution will have to be placed at the October 2005 lows. That would mean the next resolution of this turning point pattern would be due around June 2009. The pattern has now lost its potential utility to us until then because it does not tell us how long the October 2005 low can be expected to hold.

There is another cycle or turning point pattern that suggests the market may not yet be finished with its upside struggles. In our January 2006 newsletter (mistakenly labeled December 6th, 2006), we presented a combination 37-74 week cycle or turning point pattern which pointed to the period around mid January as the ideal time for a resolution of a 37-74 week turning point pattern. We are presenting an updated version of the chart used in that newsletter to depict the pattern through the close of today, March 3rd. Notice that the week the resolution was scheduled to occur according to our calculations saw the Dow move to a multi year high. This appeared to be strongly suggestive that another important market turn had occurred.
The following week, however, the Dow declined to its lowest level in over two months. At that point, it became important to monitor the high of the previous week and the low established the following week to see which one would be first penetrated. As it turned out, the Dow moved to a high above the mid January high suggesting that that high was indeed not the resolution of the turning point pattern. The only remaining alternative was to label the low of the following week as the resolution point of the 37-74 week turning point pattern. What was potentially a very bearish turning point had now turned into a potentially bullish turning point.
We now await the resolution of the 361-362 calendar day turning point pattern which we noted in our last newsletter was due between February 28th-March 9th. We continue to believe the odds strongly favor that any resolution of the pattern within that time period will more probably be a top than a bottom. That is strongly suggested by the fact that several market indexes have made new all-time highs over the past several days.
—TECHNICAL INDICATORS—
[Reserved for Subscribers]
—MARKET PROJECTIONS—
After examining all the weekly projection charts for the New York Composite Index, our most reliable projection generator, we have concluded that there is little to any upside potential remaining for that Index. The same is not necessarily true for the S&P 500 and the Dow Jones Industrial Average where a case can be made that potential nominal 4 year cycle projections have been given to higher levels. As we have said often in the past, however, when there are contradictions between the New York Composite Index and other indexes, we give significantly more weight to the projections from the New York Composite Index.
—MUTUAL FUNDS—
Both Rydex switchers and Fidelity Select switchers are in 100% cash positions. Rydex switchers sold their position in the Rydex Tempest Fund at the February 23 a.m. pricing of 37.35 for a loss of 1.6% on the trade. We anticipate the possibility of reentering the Rydex Tempest Fund sometime over the next week. Mutual-fund switchers should remain in close contact with the telephone updates.
We have now completed our first full year of real-time, real-money performance in our seasonality program. On our first anniversary date of February 24th, the performance of our seasonality portfolio based on percentage gain in relation to market risk was ranked first among a group of over 400 actively managed portfolios. The ranking was done by Theta Investment Research whose Web site can be found at: http://www.thetaresearch.com/
We are rethinking the whole operation of our management business. Stockmarket Cycles Management Inc. has been the manager of our managed accounts but there is a real possibility that SMC Management will be restructured and become the manager of a hedge fund. We will keep you apprised of the progress in this respect over the next several weeks and months.
We have two different specific model portfolios- one for Fidelity Select switchers and one for Rydex Group switchers. How you distribute your own portfolio is up to you as an individual.
“Stockmarket Cycles” is published the first Friday of the month by Peter G. Eliades. Information is gathered as carefully as possible, but no guarantee can be made as to the accuracy of text or charts. The analysis of stock market cycles is more an art than a science. No guarantee can be made that recommendations will be profitable or will not result in losses. This subscription will not be reassigned without the consent of the subscriber. All information contained herein and given on the telephone update may not be reproduced or rebroadcast in any form whatsoever without the written consent of Peter G. Eliades.
1 year (12 issues) letters only $252.00 6 months (6 issues) with daily telephone update $261.00
1 year (12 issues) with daily telephone update $480.00 2 issue trial with daily telephone update $98.00
About Peter Eliades


